 1
1peptide
spectra
0.000 | 0.182
0.213 | 0.469
0.000 | 0.120
0.000 | 0.000
0.000 | 0.000
0.357 | 0.627
0.000 | 0.022
0.000 | 0.061
1peptide
spectra
NA | NA
NA | NA
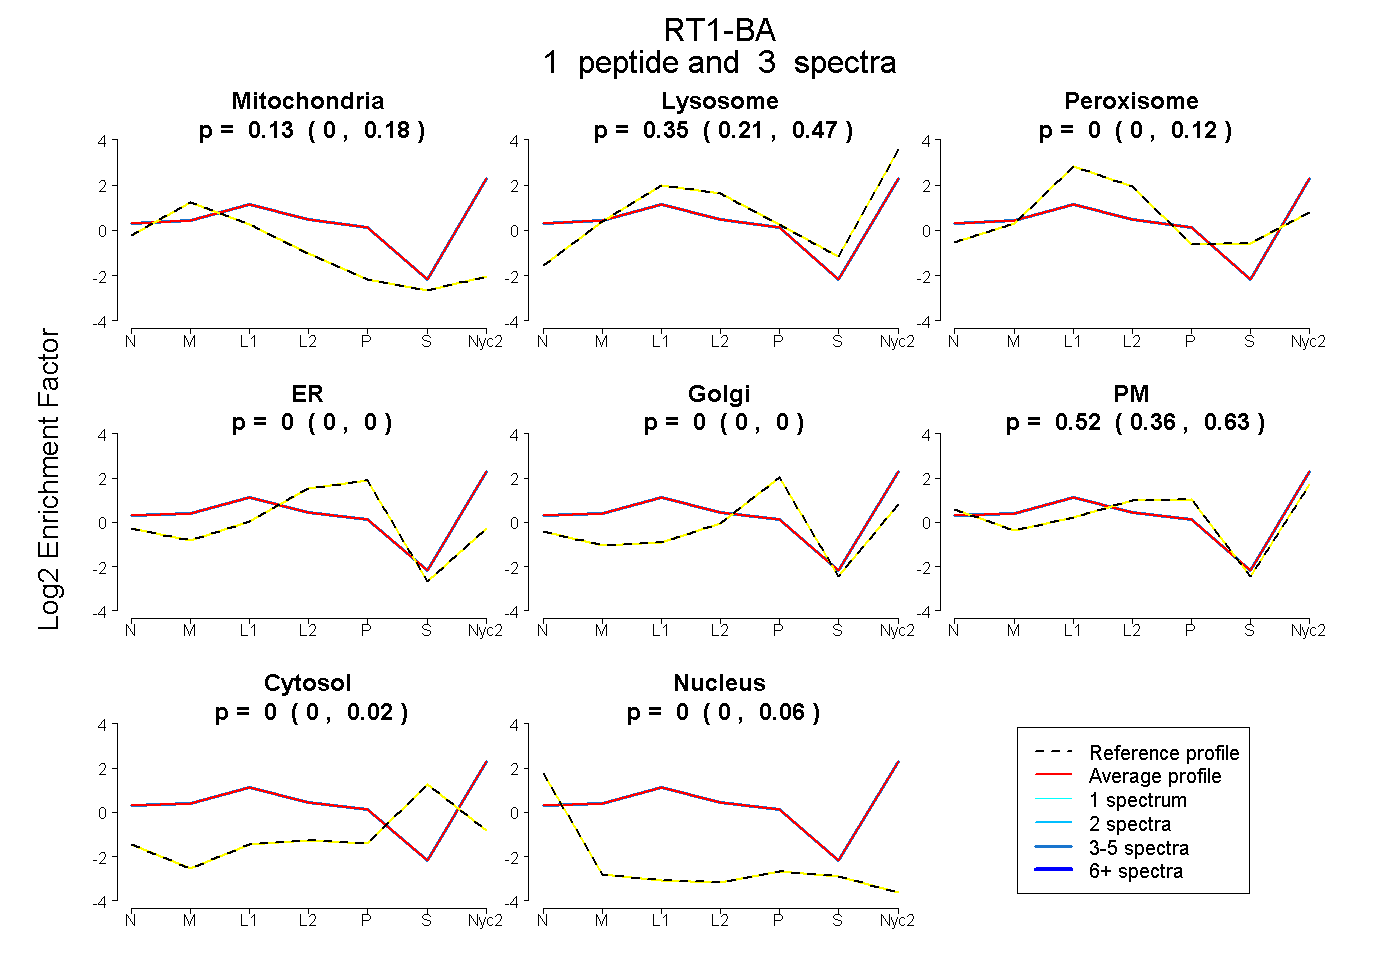
| Plot | Mito | Lyso | Perox | ER | Golgi | PM | Cytosol | Nucleus | |||||
| Expt A |
1 peptide |
3 spectra |
|
0.135 0.000 | 0.182 |
0.349 0.213 | 0.469 |
0.000 0.000 | 0.120 |
0.000 0.000 | 0.000 |
0.000 0.000 | 0.000 |
0.516 0.357 | 0.627 |
0.000 0.000 | 0.022 |
0.000 0.000 | 0.061 |
||
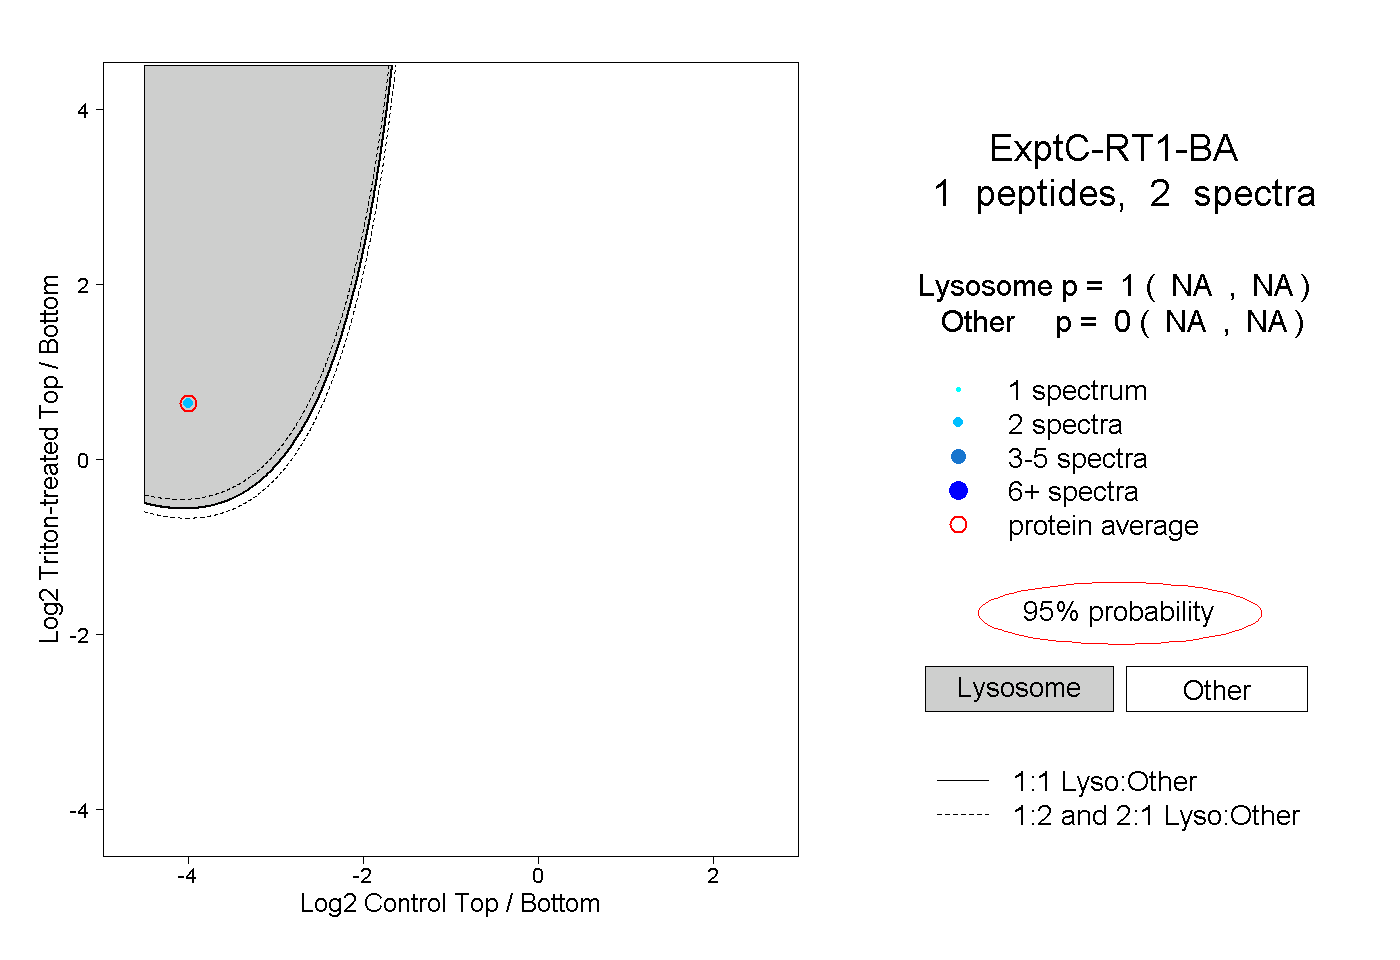
| Plot | Lyso | Other | |||||||||||
| Expt C |
1 peptide |
2 spectra |
|
1.000 NA | NA |
0.000 NA | NA |