 5
5peptides
spectra
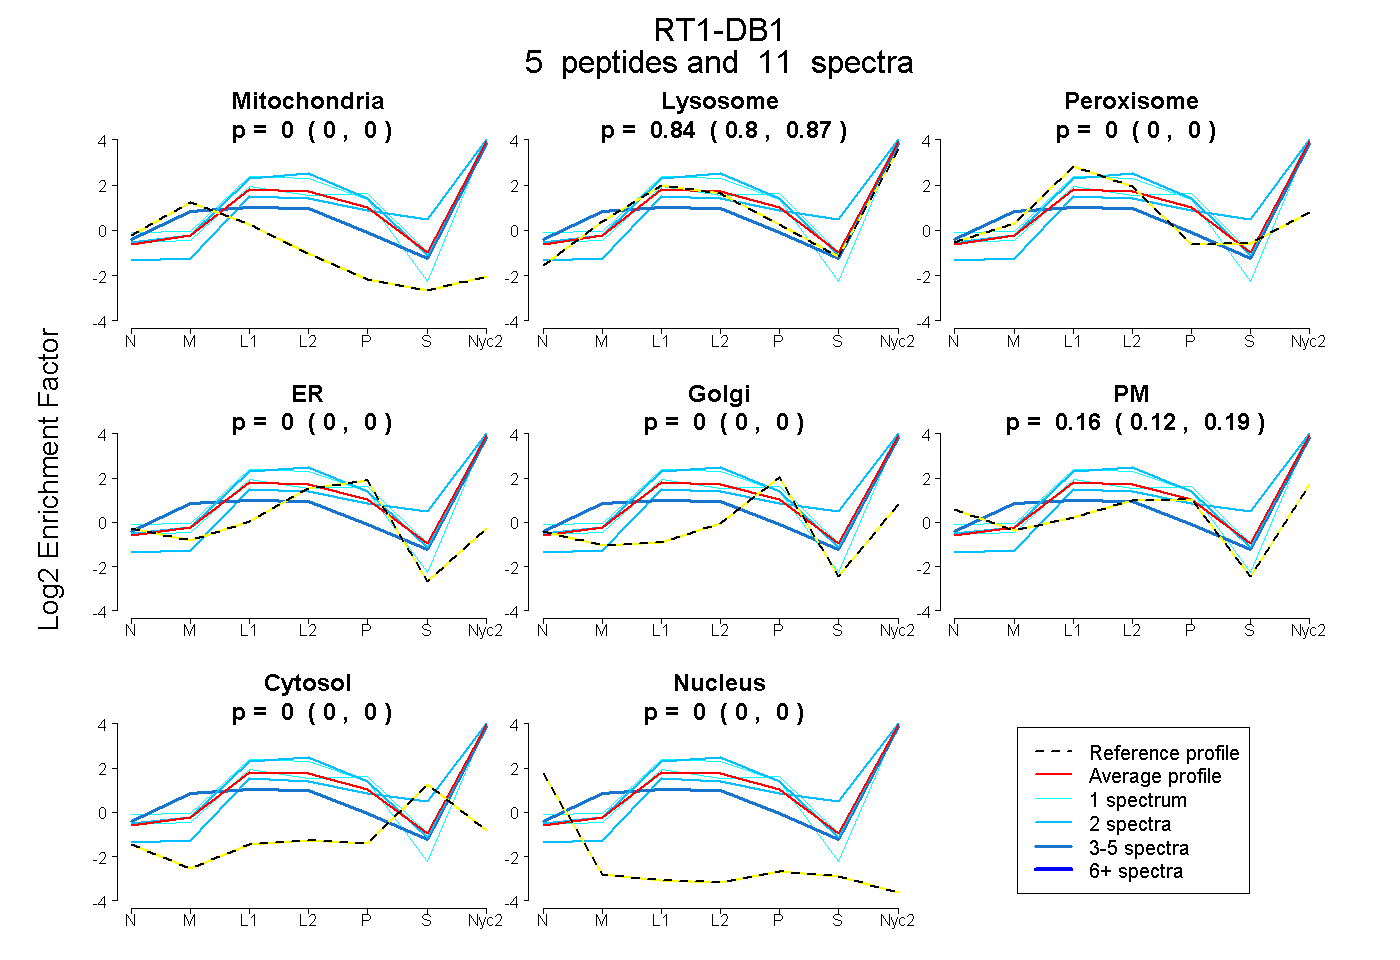
0.000 | 0.000
0.803 | 0.872
0.000 | 0.000
0.000 | 0.000
0.000 | 0.000
0.121 | 0.191
0.000 | 0.000
0.000 | 0.000
4peptides
spectra

0.000 | 0.000
0.676 | 0.802
0.010 | 0.274
0.000 | 0.156
0.000 | 0.023
0.000 | 0.067
0.000 | 0.013
5peptides
spectra
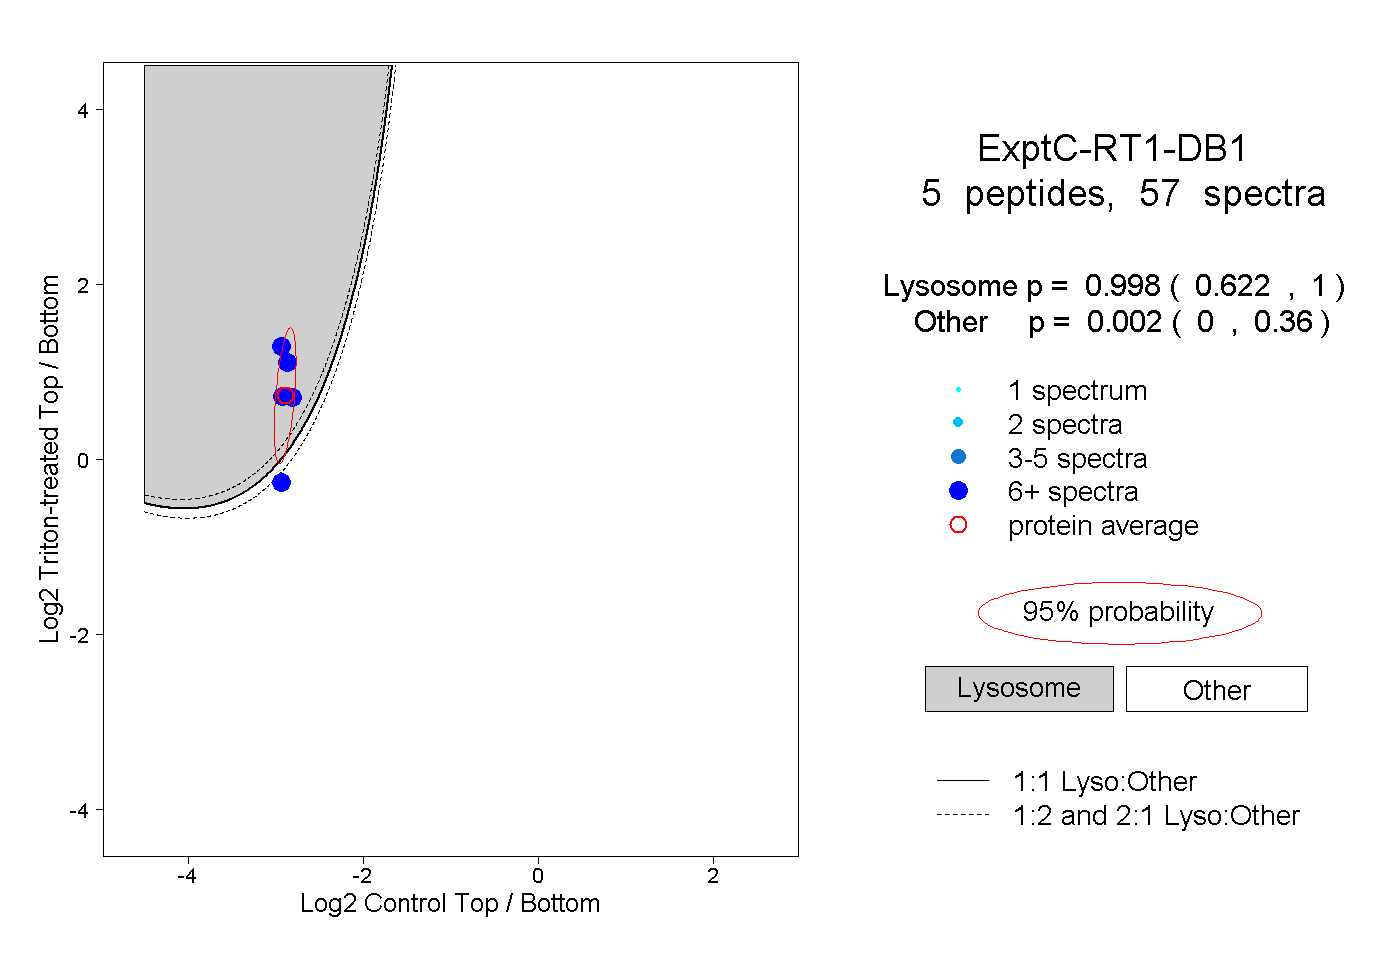
0.622 | 1.000
0.000 | 0.360
2peptides
spectra
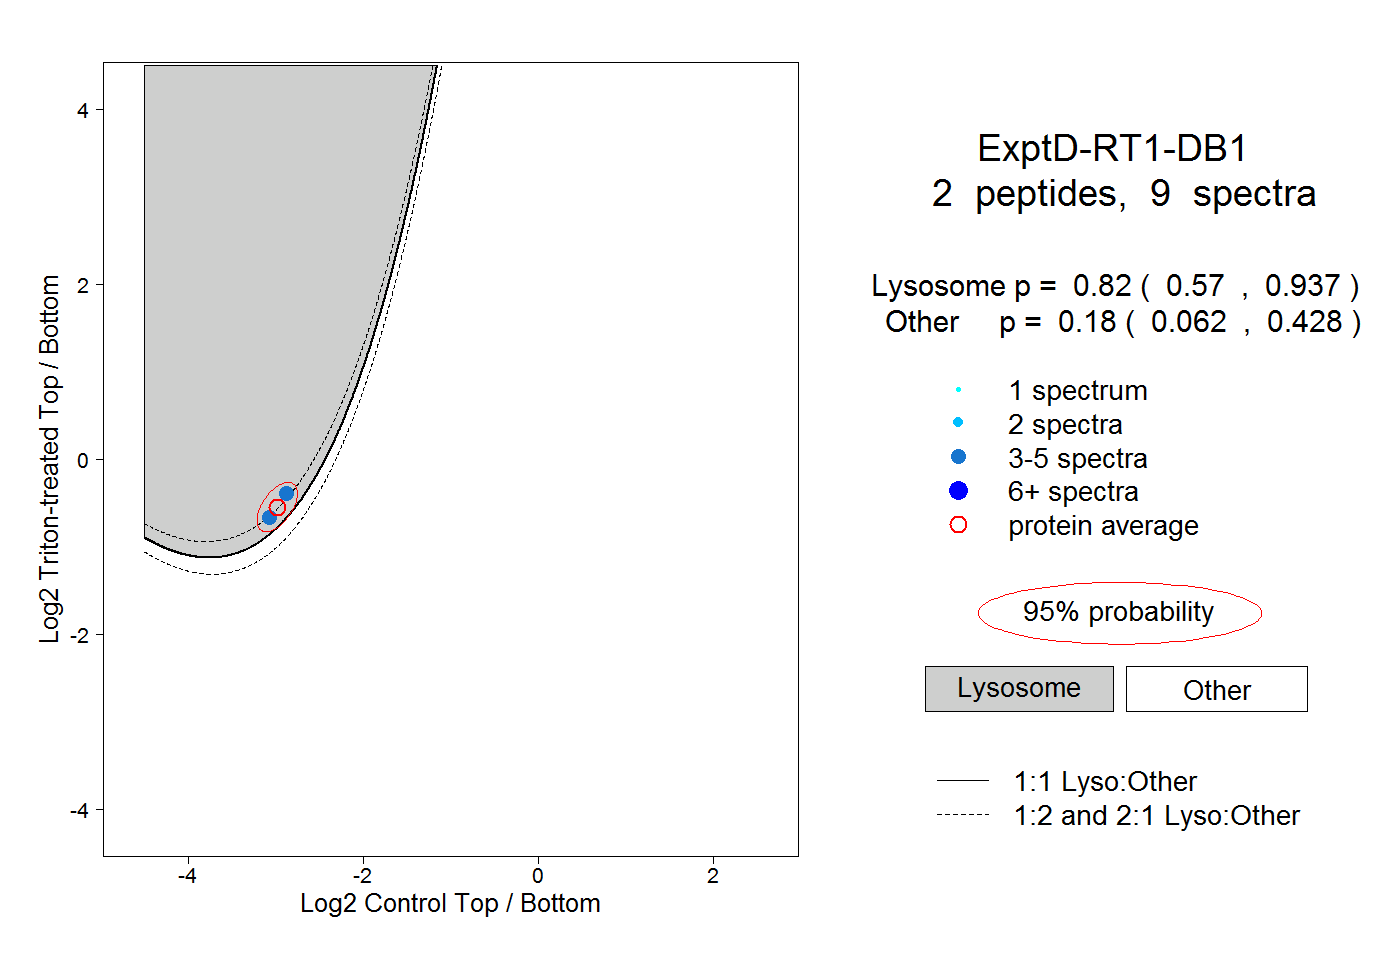
0.570 | 0.937
0.062 | 0.428