 3
3peptides
spectra
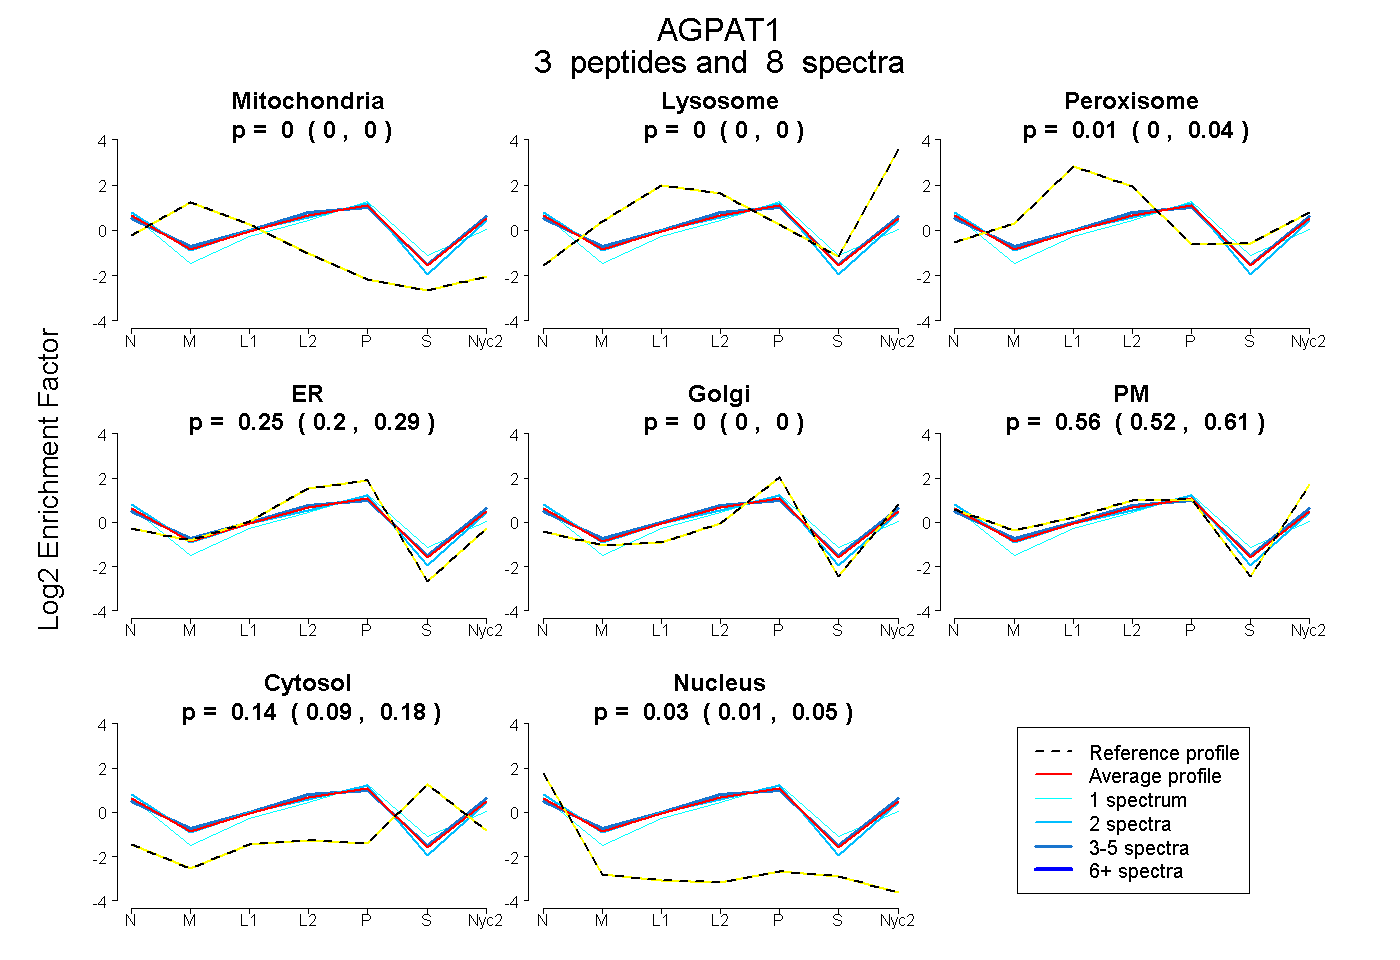
0.000 | 0.000
0.000 | 0.000
0.000 | 0.036
0.202 | 0.288
0.000 | 0.000
0.519 | 0.606
0.094 | 0.176
0.008 | 0.055
| Plot | Mito | Lyso | Perox | ER | Golgi | PM | Cytosol | Nucleus | |||||
| Expt A |
3 peptides |
8 spectra |
|
0.000 0.000 | 0.000 |
0.000 0.000 | 0.000 |
0.015 0.000 | 0.036 |
0.248 0.202 | 0.288 |
0.000 0.000 | 0.000 |
0.564 0.519 | 0.606 |
0.140 0.094 | 0.176 |
0.033 0.008 | 0.055 |