 10
10peptides
spectra
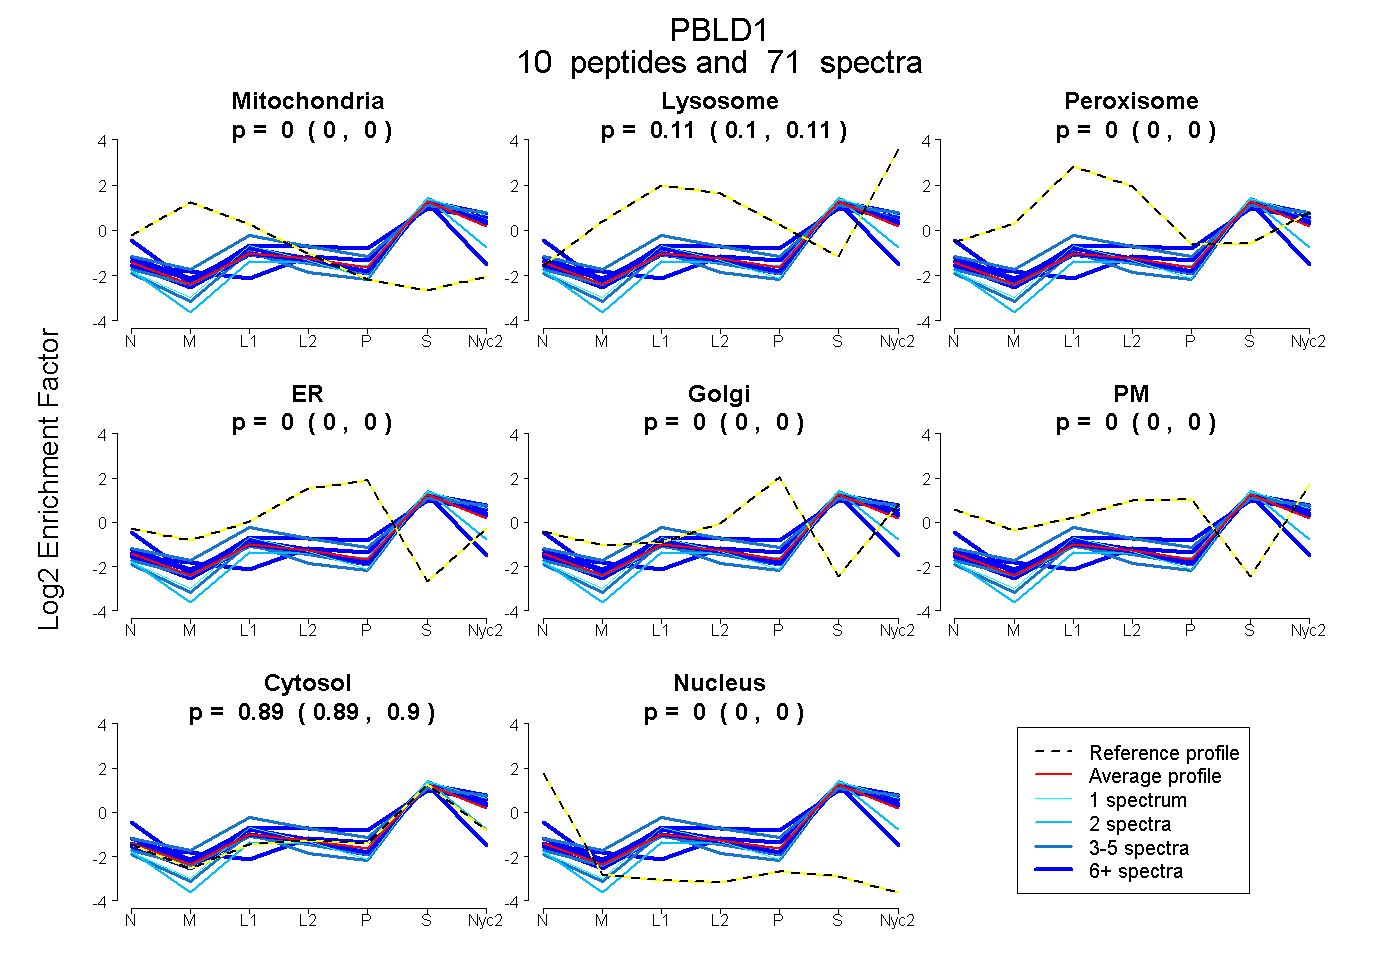
0.000 | 0.000
0.102 | 0.111
0.000 | 0.000
0.000 | 0.000
0.000 | 0.000
0.000 | 0.000
0.888 | 0.898
0.000 | 0.000
6peptides
spectra
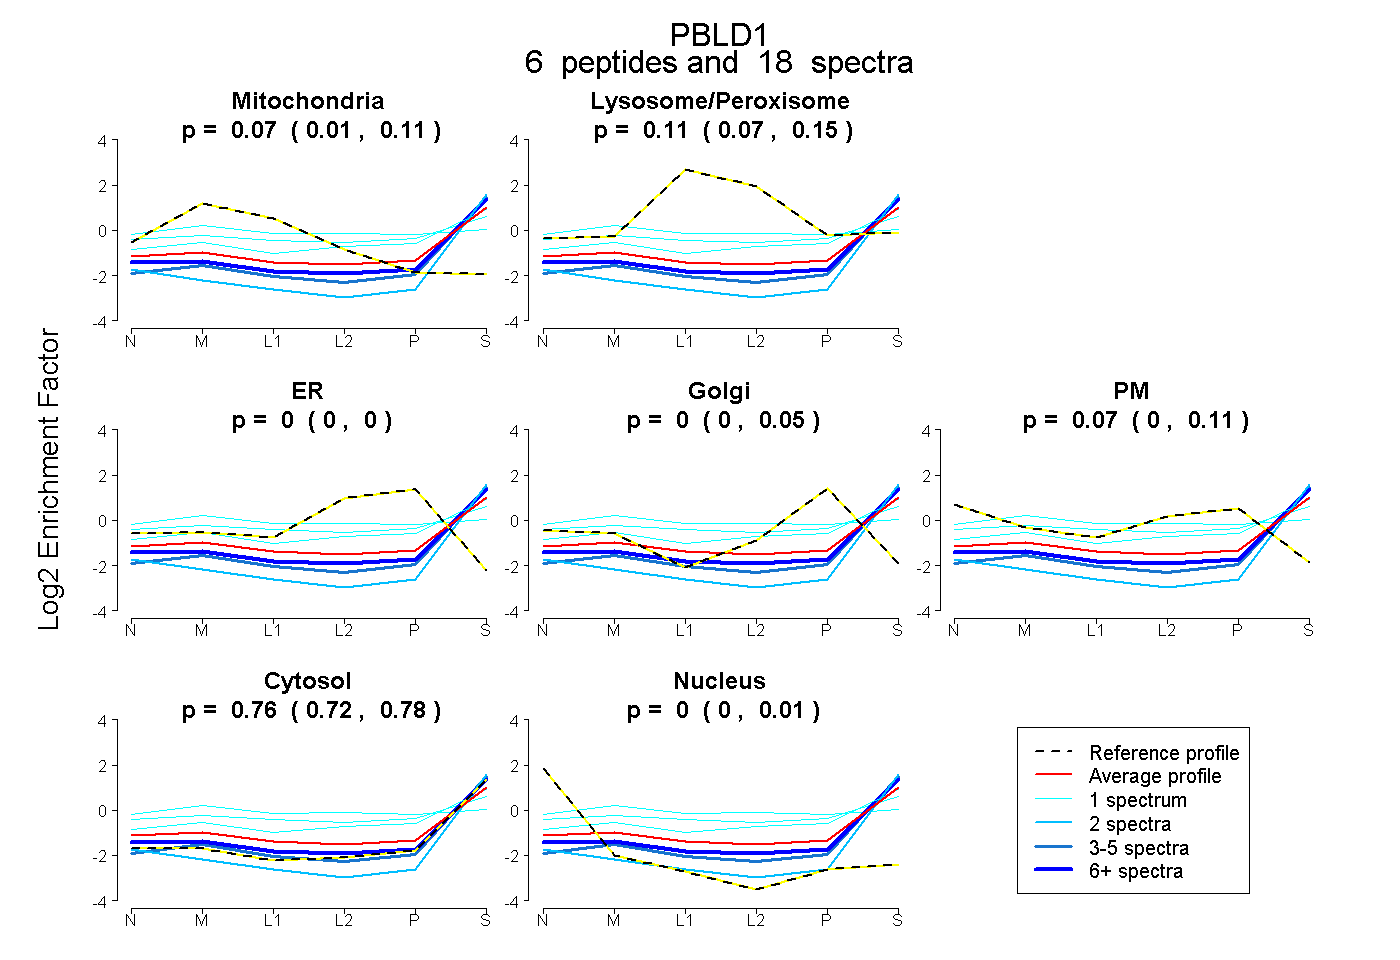
0.011 | 0.113
0.069 | 0.151
0.000 | 0.000
0.000 | 0.054
0.000 | 0.108
0.725 | 0.778
0.000 | 0.015
10peptides
spectra
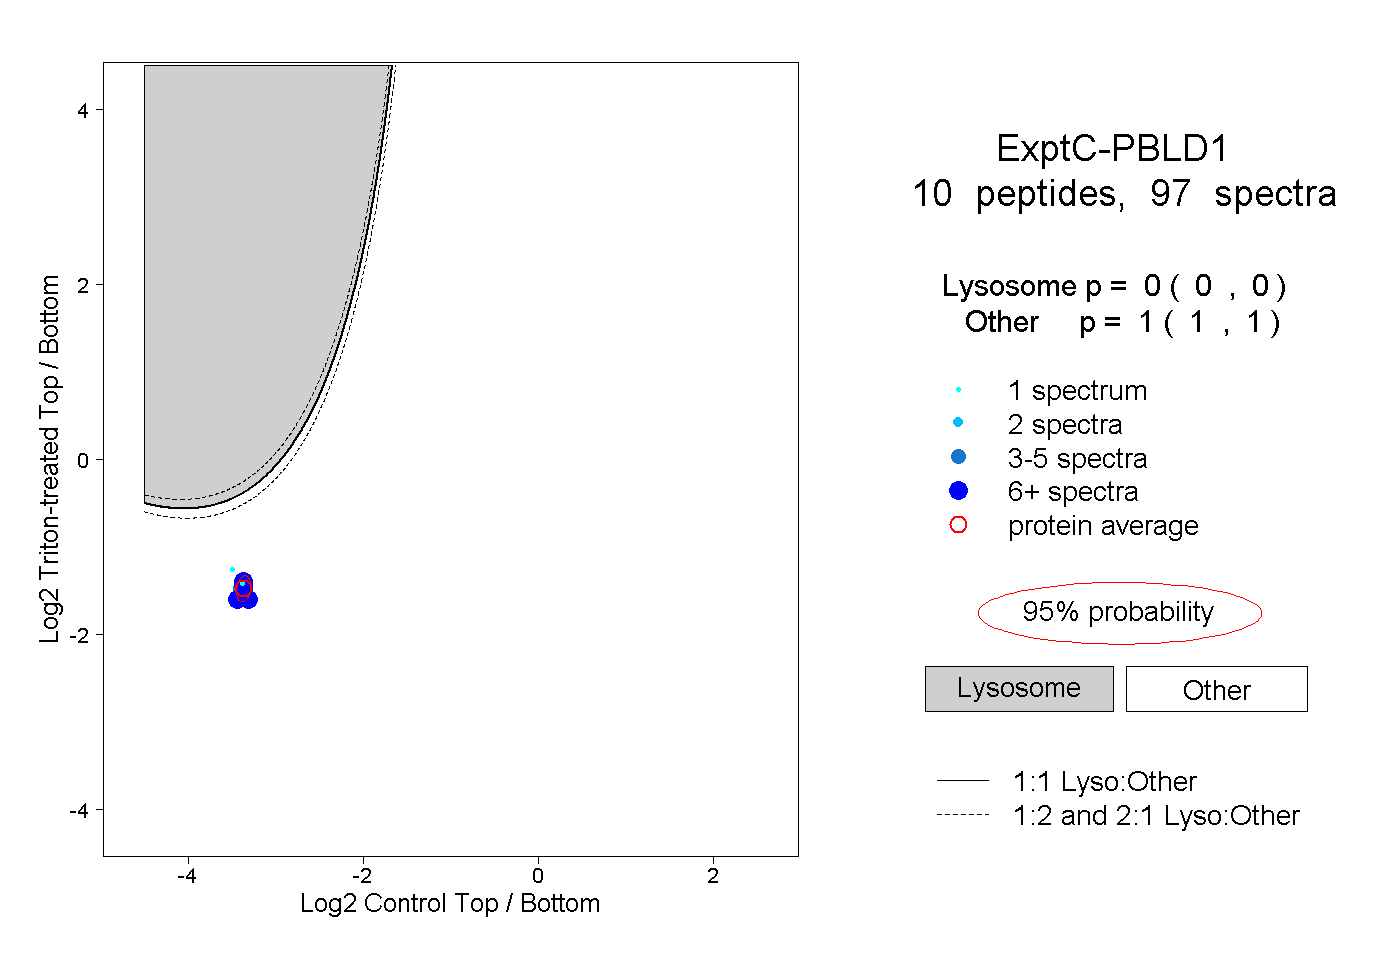
0.000 | 0.000
1.000 | 1.000
4peptides
spectra
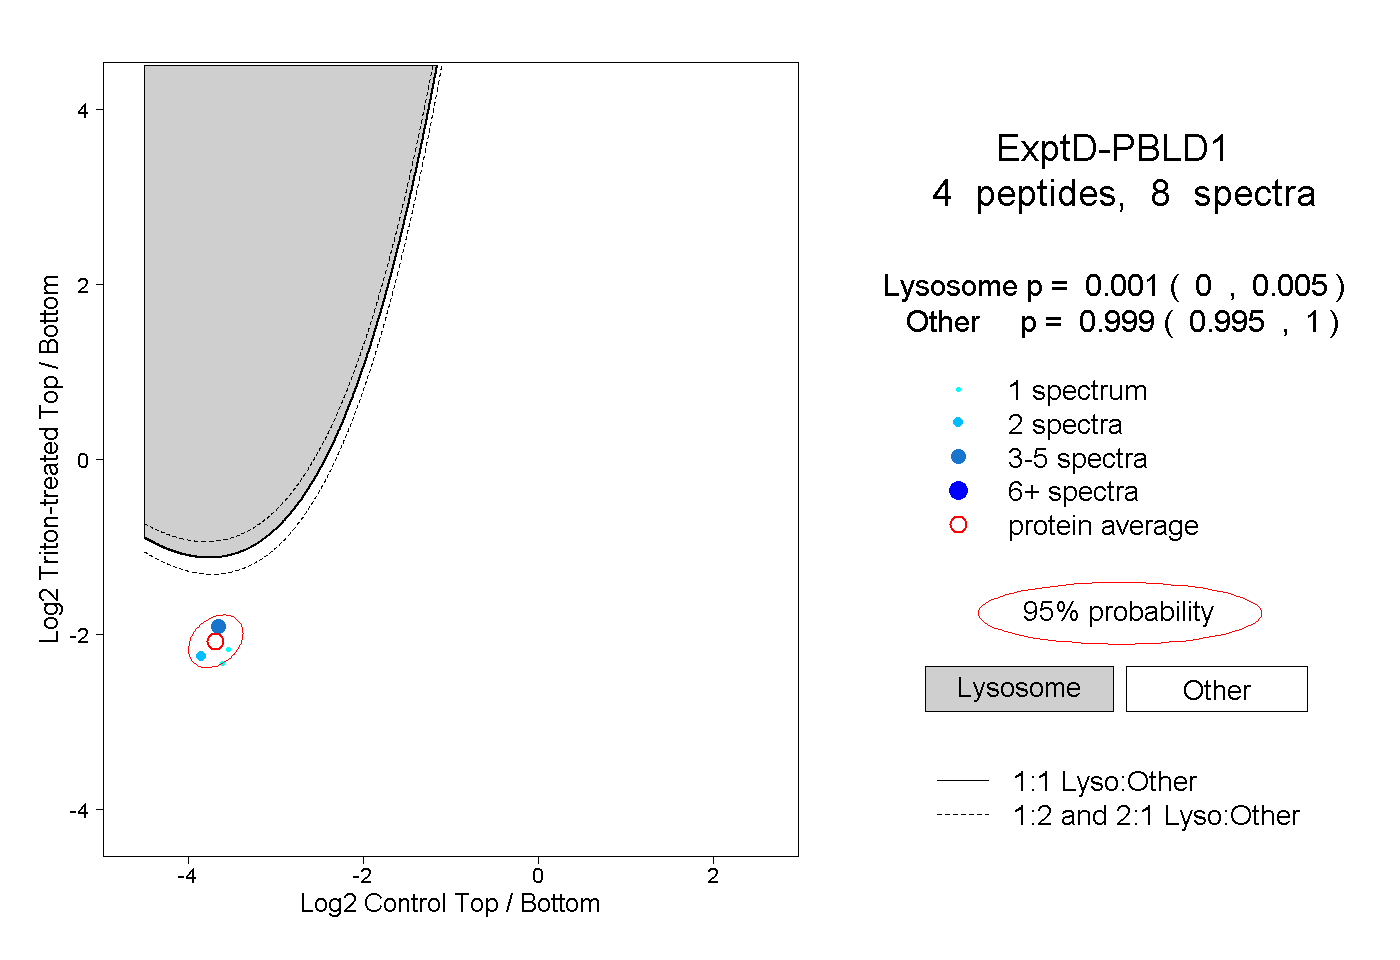
0.000 | 0.005
0.995 | 1.000