 10
10peptides
spectra
0.000 | 0.000
0.151 | 0.304
0.000 | 0.017
0.000 | 0.000
0.000 | 0.000
0.000 | 0.167
0.133 | 0.198
0.454 | 0.547
2peptides
spectra
NA | NA
NA | NA
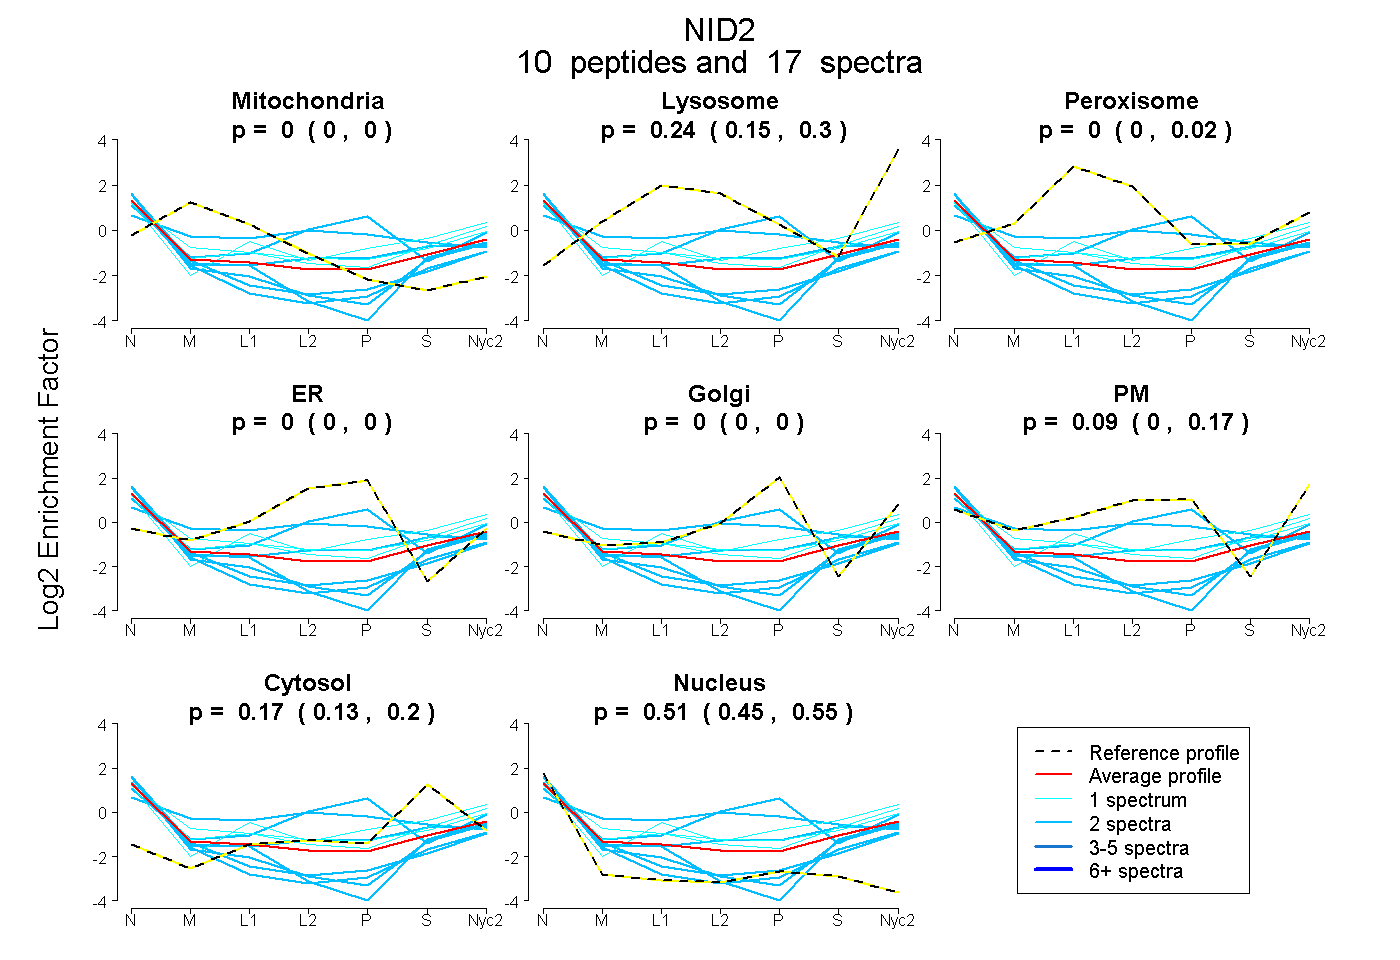
| Plot | Mito | Lyso | Perox | ER | Golgi | PM | Cytosol | Nucleus | |||||
| Expt A |
10 peptides |
17 spectra |
|
0.000 0.000 | 0.000 |
0.240 0.151 | 0.304 |
0.000 0.000 | 0.017 |
0.000 0.000 | 0.000 |
0.000 0.000 | 0.000 |
0.085 0.000 | 0.167 |
0.167 0.133 | 0.198 |
0.507 0.454 | 0.547 |
||
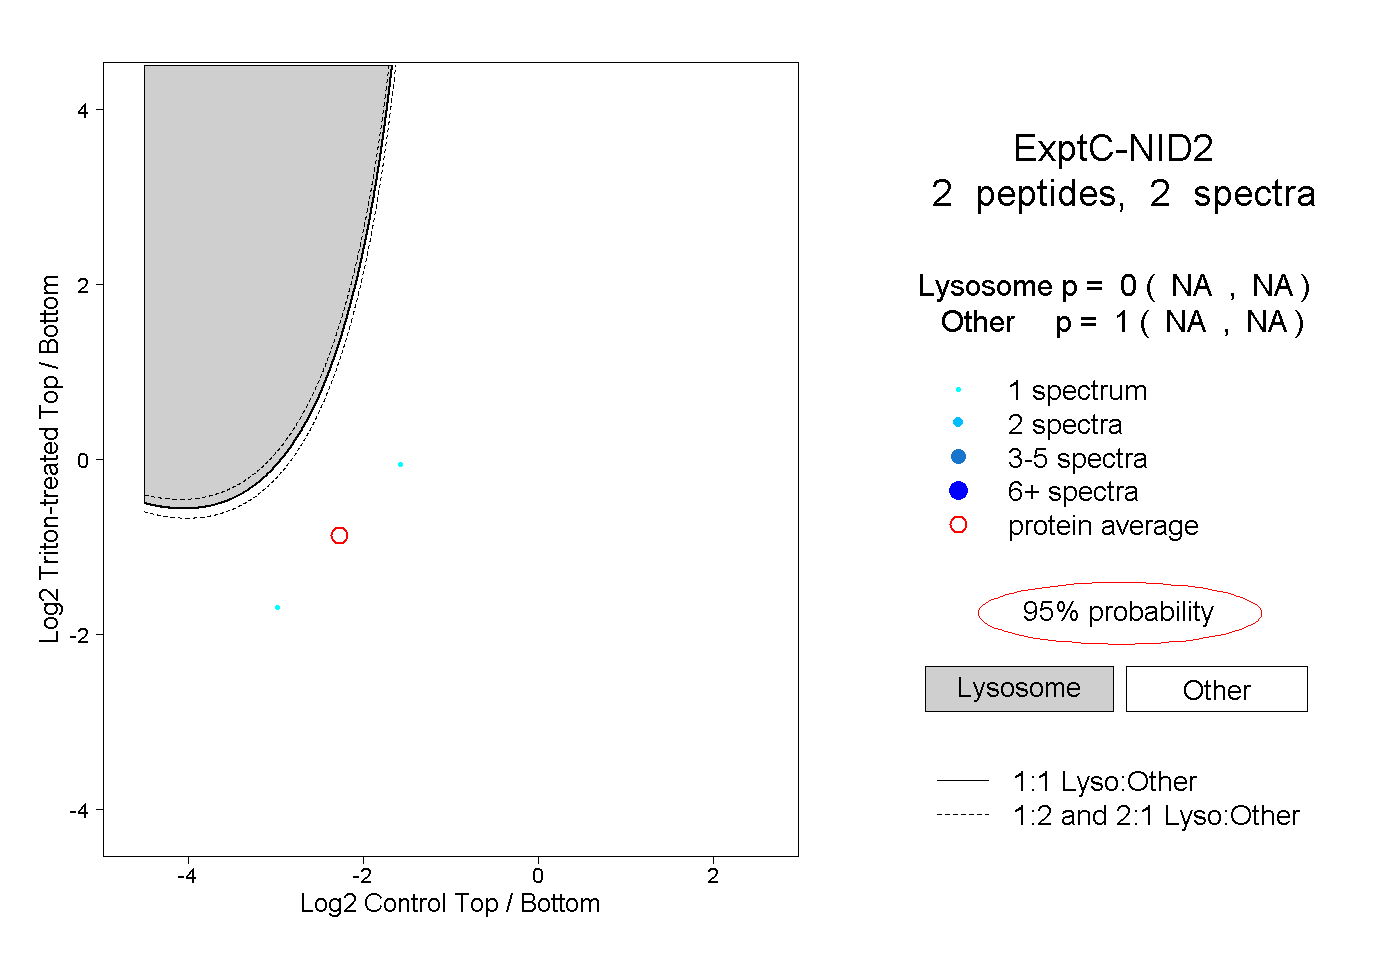
| Plot | Lyso | Other | |||||||||||
| Expt C |
2 peptides |
2 spectra |
|
0.000 NA | NA |
1.000 NA | NA |