 3
3peptides
spectra
0.000 | 0.000
0.079 | 0.206
0.000 | 0.103
0.000 | 0.000
0.441 | 0.501
0.000 | 0.019
0.298 | 0.347
0.000 | 0.000
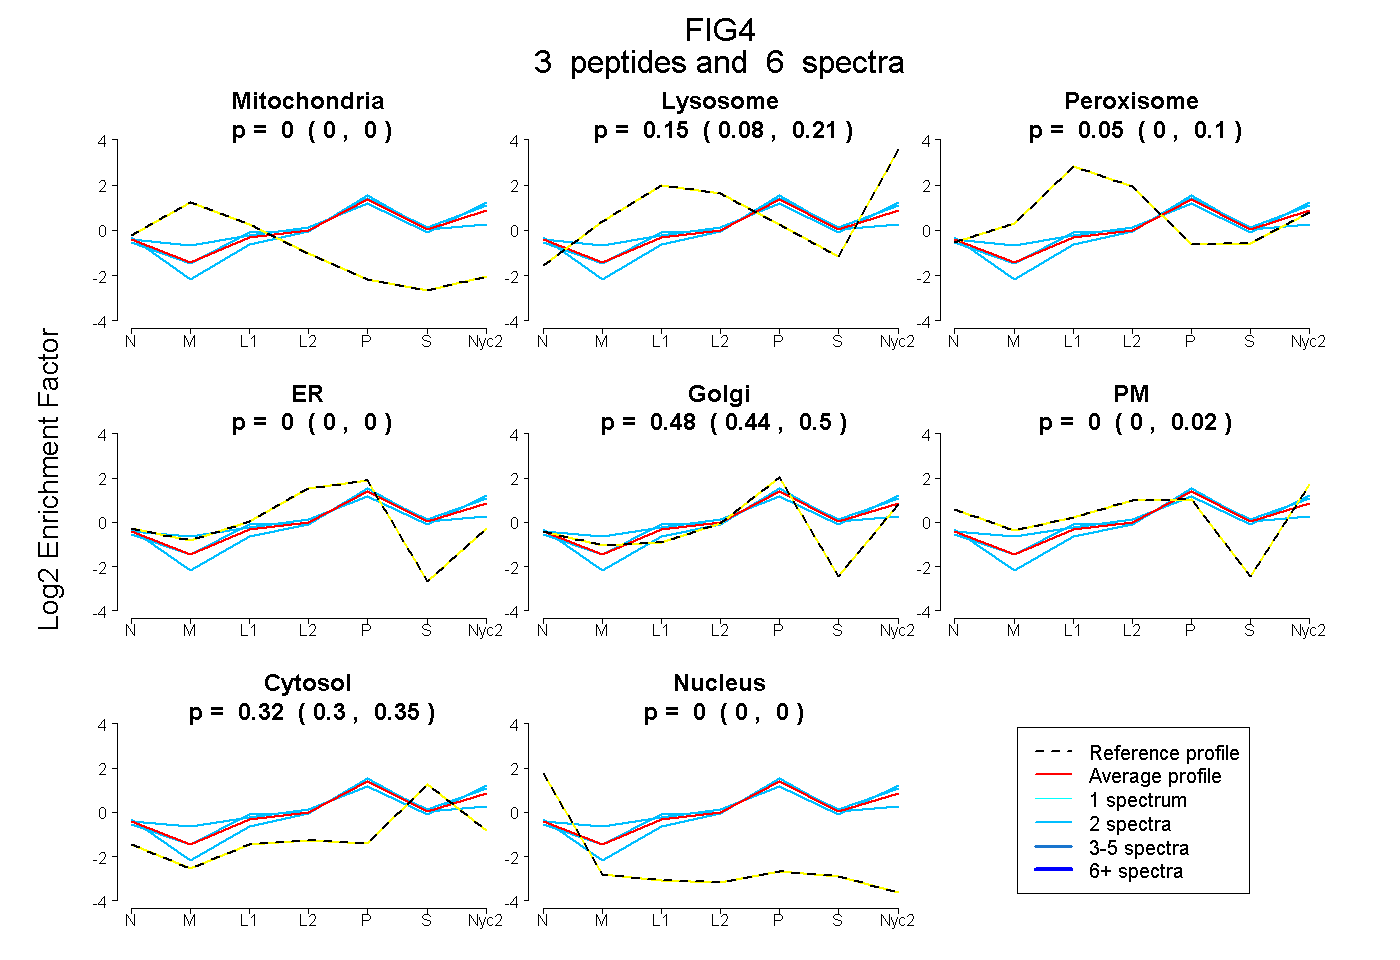
| Plot | Mito | Lyso | Perox | ER | Golgi | PM | Cytosol | Nucleus | |||||
| Expt A |
3 peptides |
6 spectra |
|
0.000 0.000 | 0.000 |
0.153 0.079 | 0.206 |
0.046 0.000 | 0.103 |
0.000 0.000 | 0.000 |
0.477 0.441 | 0.501 |
0.000 0.000 | 0.019 |
0.324 0.298 | 0.347 |
0.000 0.000 | 0.000 |
| 2 spectra, EDTAIYR | 0.000 | 0.006 | 0.019 | 0.107 | 0.473 | 0.000 | 0.395 | 0.000 | ||
| 2 spectra, LVLYETR | 0.000 | 0.253 | 0.016 | 0.000 | 0.360 | 0.089 | 0.282 | 0.000 | ||
| 2 spectra, AVSAFGVVGFVR | 0.000 | 0.238 | 0.009 | 0.000 | 0.422 | 0.000 | 0.331 | 0.000 |
| Plot | Mito | Lyso or Perox | ER | Golgi | PM | Cytosol | Nucleus | ||||||
| Expt B |
1 peptide |
2 spectra |
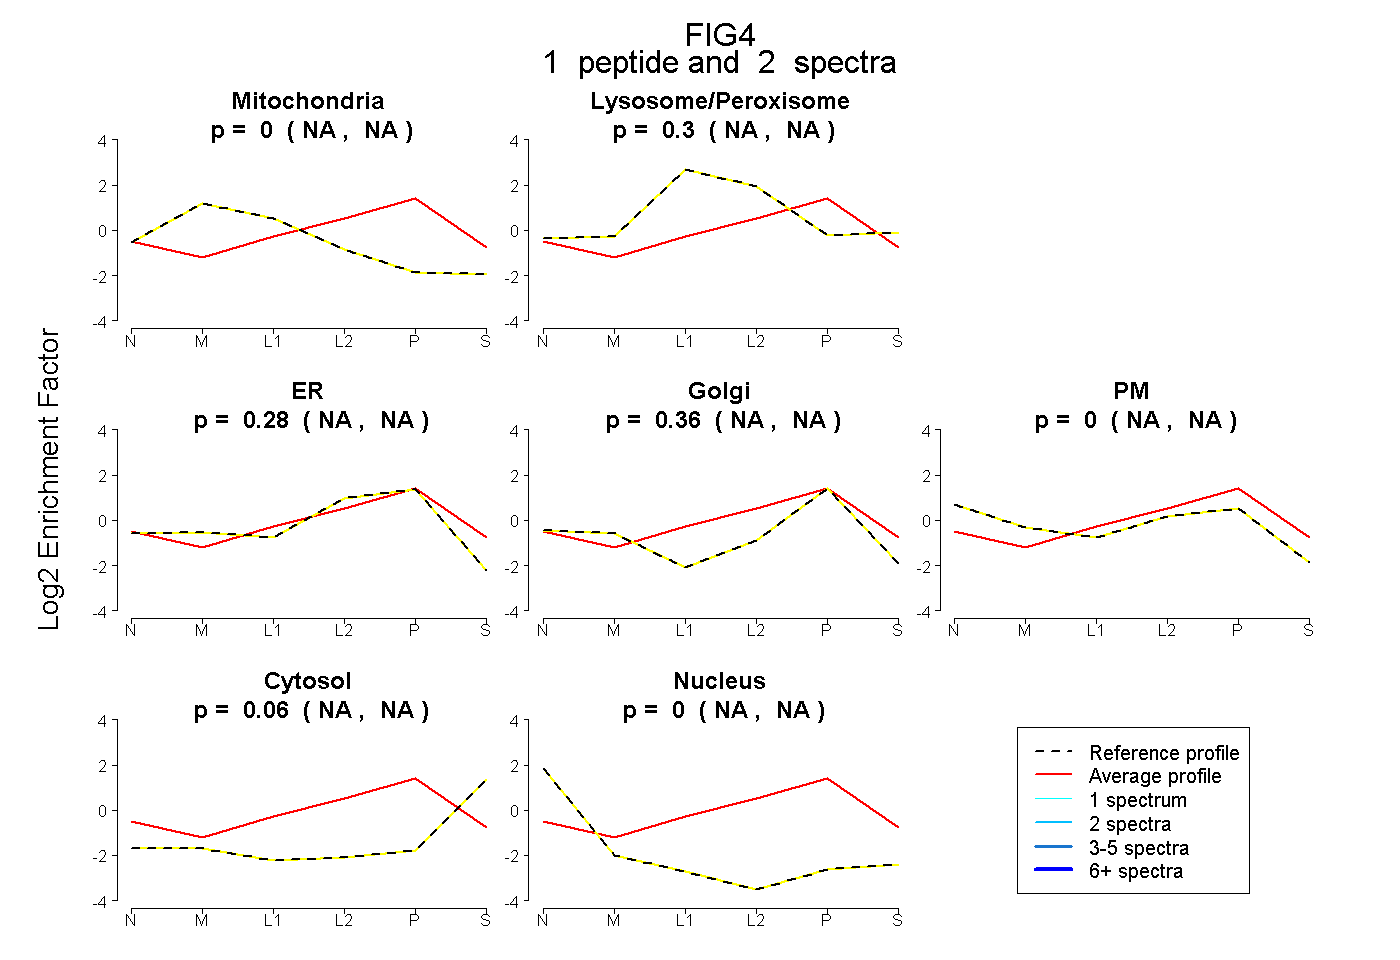 |
0.000 NA | NA |
0.299 NA | NA |
0.283 NA | NA |
0.357 NA | NA |
0.000 NA | NA |
0.062 NA | NA |
0.000 NA | NA |
|||
| Plot | Lyso | Other | |||||||||||
| Expt C |
11 peptides |
19 spectra |
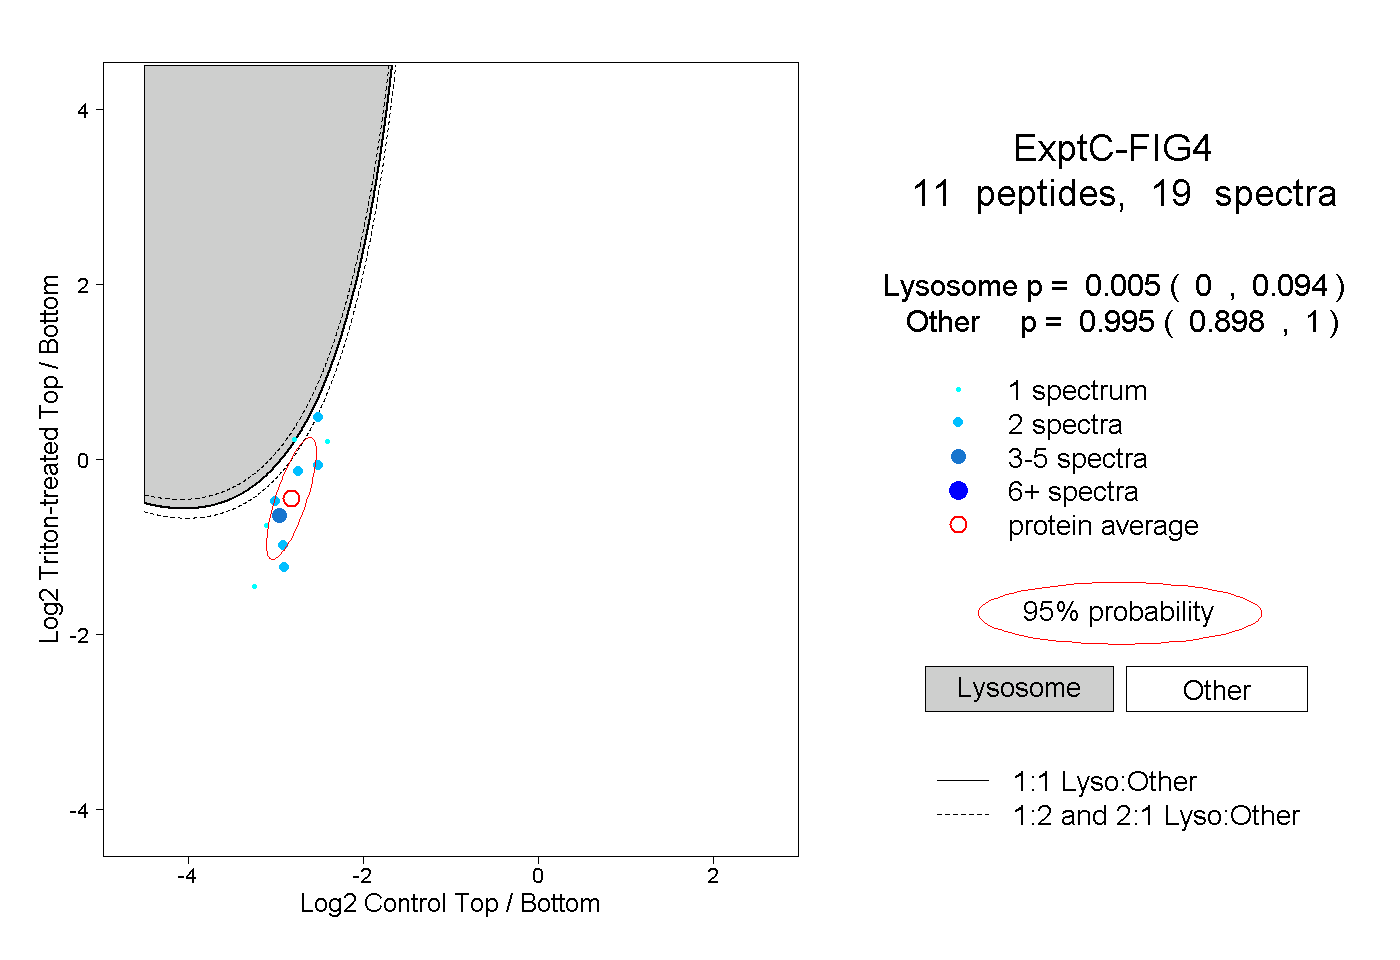 |
0.005 0.000 | 0.094 |
0.995 0.898 | 1.000 |
||||||||
| Plot | Lyso | Other | |||||||||||
| Expt D |
3 peptides |
3 spectra |
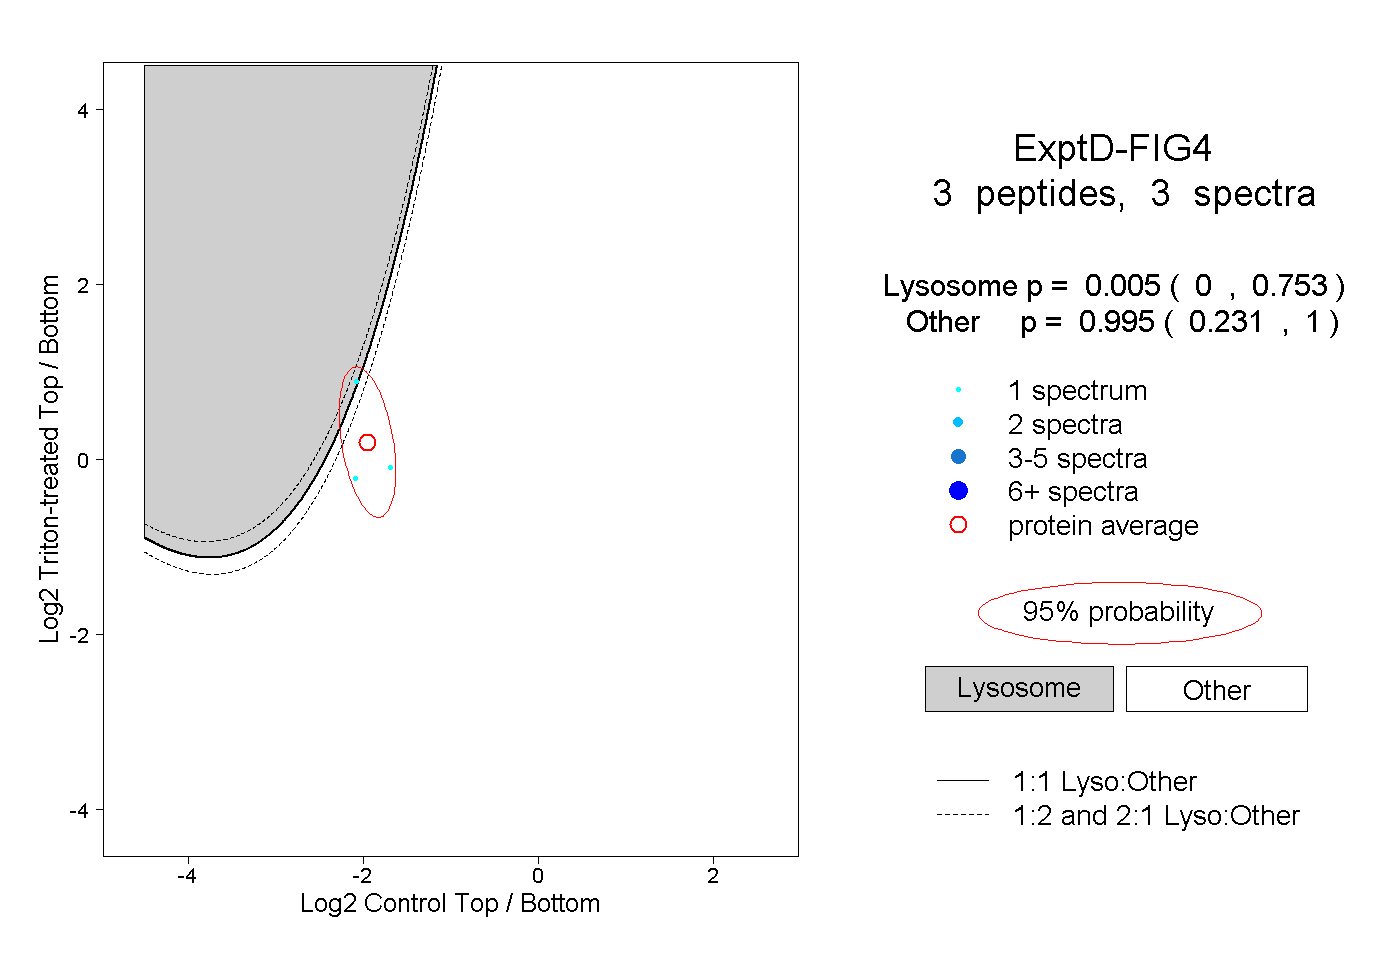 |
0.005 0.000 | 0.753 |
0.995 0.231 | 1.000 |