 7
7peptides
spectra
0.795 | 0.851
0.000 | 0.069
0.036 | 0.114
0.000 | 0.000
0.000 | 0.000
0.000 | 0.000
0.042 | 0.082
0.000 | 0.000
| Plot | Mito | Lyso | Perox | ER | Golgi | PM | Cytosol | Nucleus | |||||
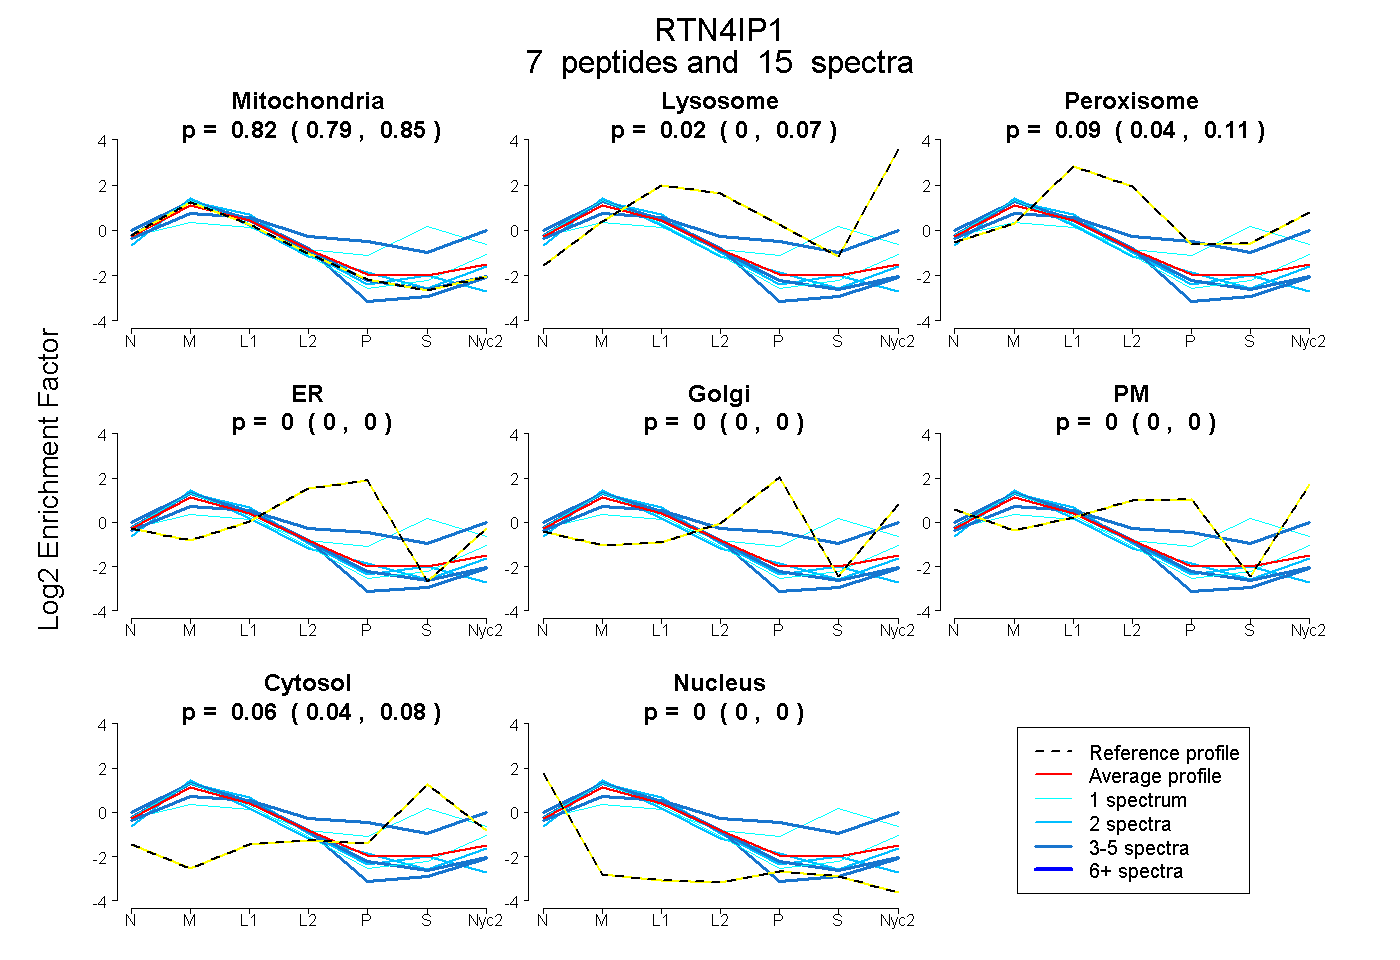
| Expt A |
7 peptides |
15 spectra |
|
0.823 0.795 | 0.851 |
0.025 0.000 | 0.069 |
0.088 0.036 | 0.114 |
0.000 0.000 | 0.000 |
0.000 0.000 | 0.000 |
0.000 0.000 | 0.000 |
0.064 0.042 | 0.082 |
0.000 0.000 | 0.000 |
| 2 spectra, HLWQGVHYR | 0.931 | 0.046 | 0.000 | 0.000 | 0.023 | 0.000 | 0.000 | 0.000 | ||
| 3 spectra, SGYGATALNMK | 0.390 | 0.161 | 0.174 | 0.000 | 0.130 | 0.015 | 0.131 | 0.000 | ||
| 3 spectra, IRPVIER | 1.000 | 0.000 | 0.000 | 0.000 | 0.000 | 0.000 | 0.000 | 0.000 | ||
| 2 spectra, DVSGVVMECGLDVR | 0.977 | 0.000 | 0.004 | 0.000 | 0.000 | 0.000 | 0.019 | 0.000 | ||
| 1 spectrum, VGGLNAK | 0.889 | 0.087 | 0.000 | 0.000 | 0.000 | 0.000 | 0.024 | 0.000 | ||
| 1 spectrum, DASELVR | 0.353 | 0.027 | 0.228 | 0.000 | 0.000 | 0.000 | 0.392 | 0.000 | ||
| 3 spectra, TFPFSEVPEAFLK | 0.970 | 0.000 | 0.030 | 0.000 | 0.000 | 0.000 | 0.000 | 0.000 |
| Plot | Mito | Lyso or Perox | ER | Golgi | PM | Cytosol | Nucleus | ||||||
| Expt B |
3 peptides |
7 spectra |
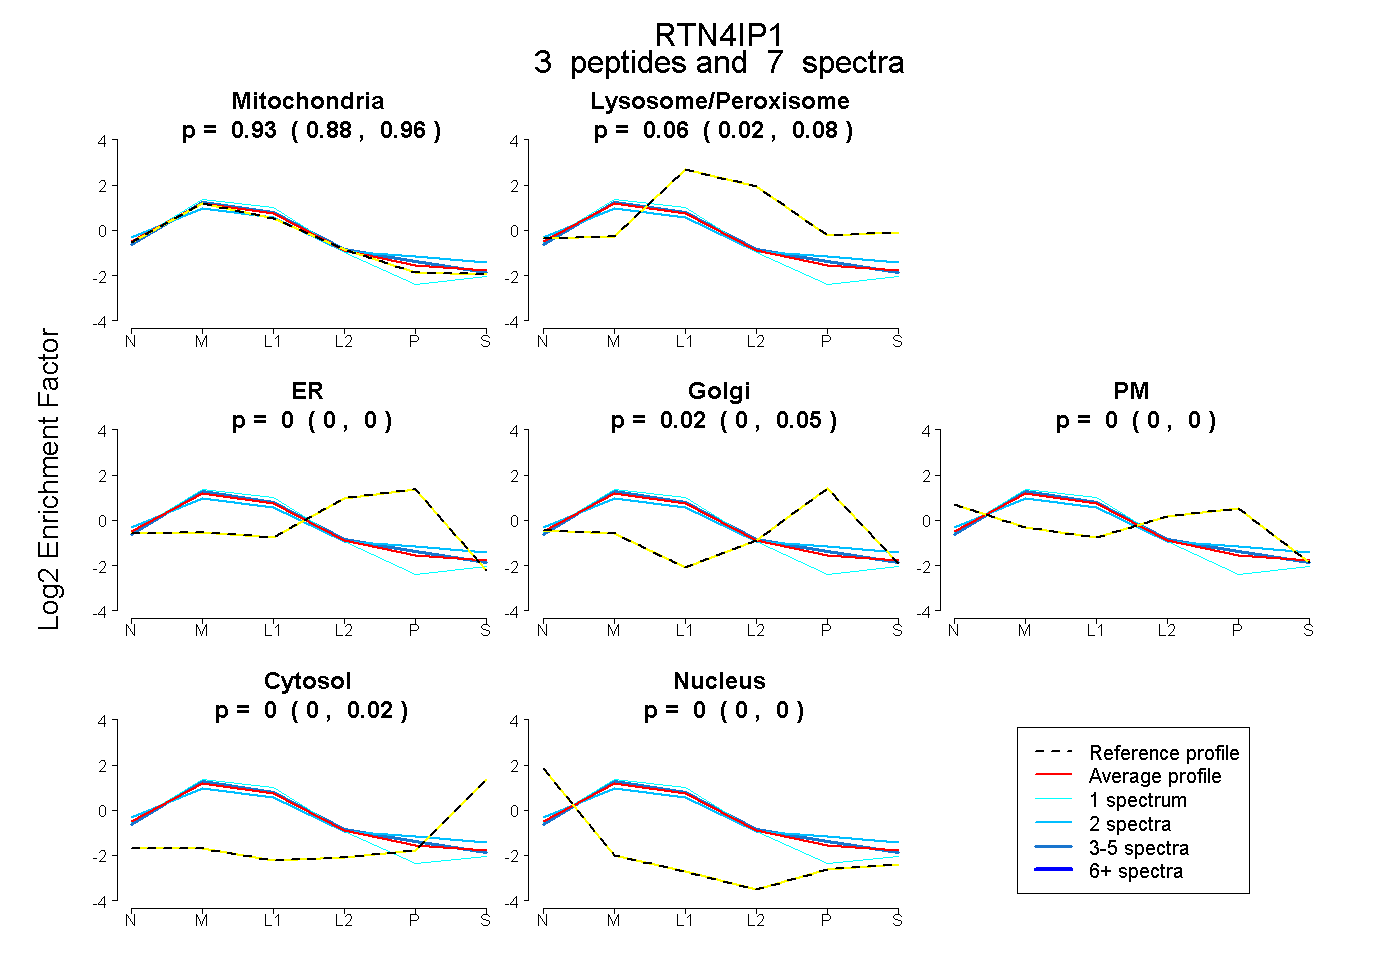 |
0.926 0.878 | 0.961 |
0.055 0.024 | 0.077 |
0.000 0.000 | 0.000 |
0.019 0.000 | 0.046 |
0.000 0.000 | 0.000 |
0.000 0.000 | 0.021 |
0.000 0.000 | 0.000 |
|||
| Plot | Lyso | Other | |||||||||||
| Expt C |
11 peptides |
66 spectra |
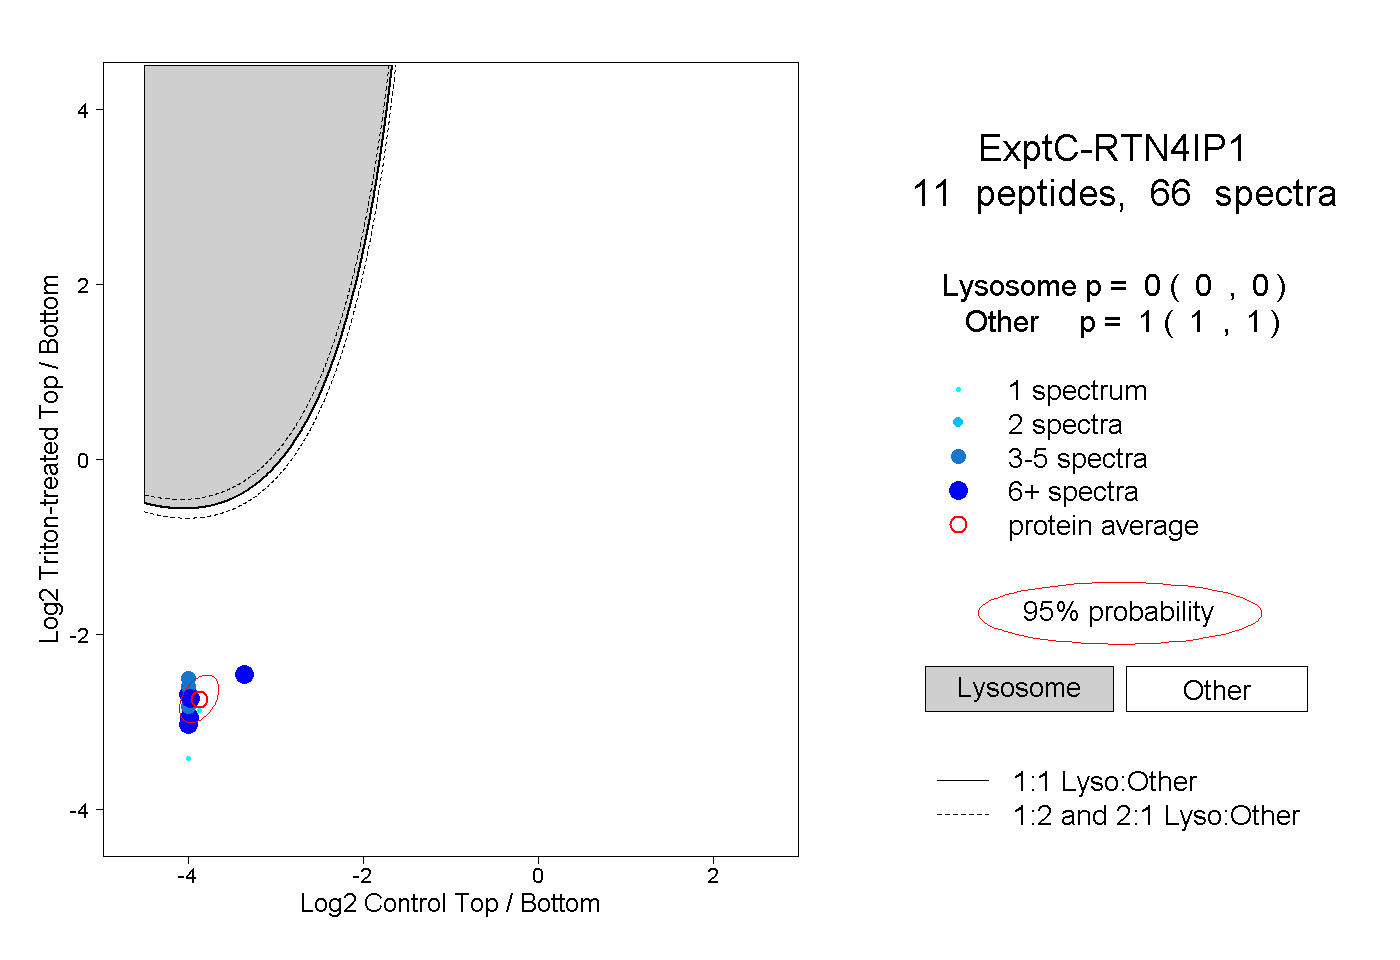 |
0.000 0.000 | 0.000 |
1.000 1.000 | 1.000 |
||||||||
| Plot | Lyso | Other | |||||||||||
| Expt D |
4 peptides |
6 spectra |
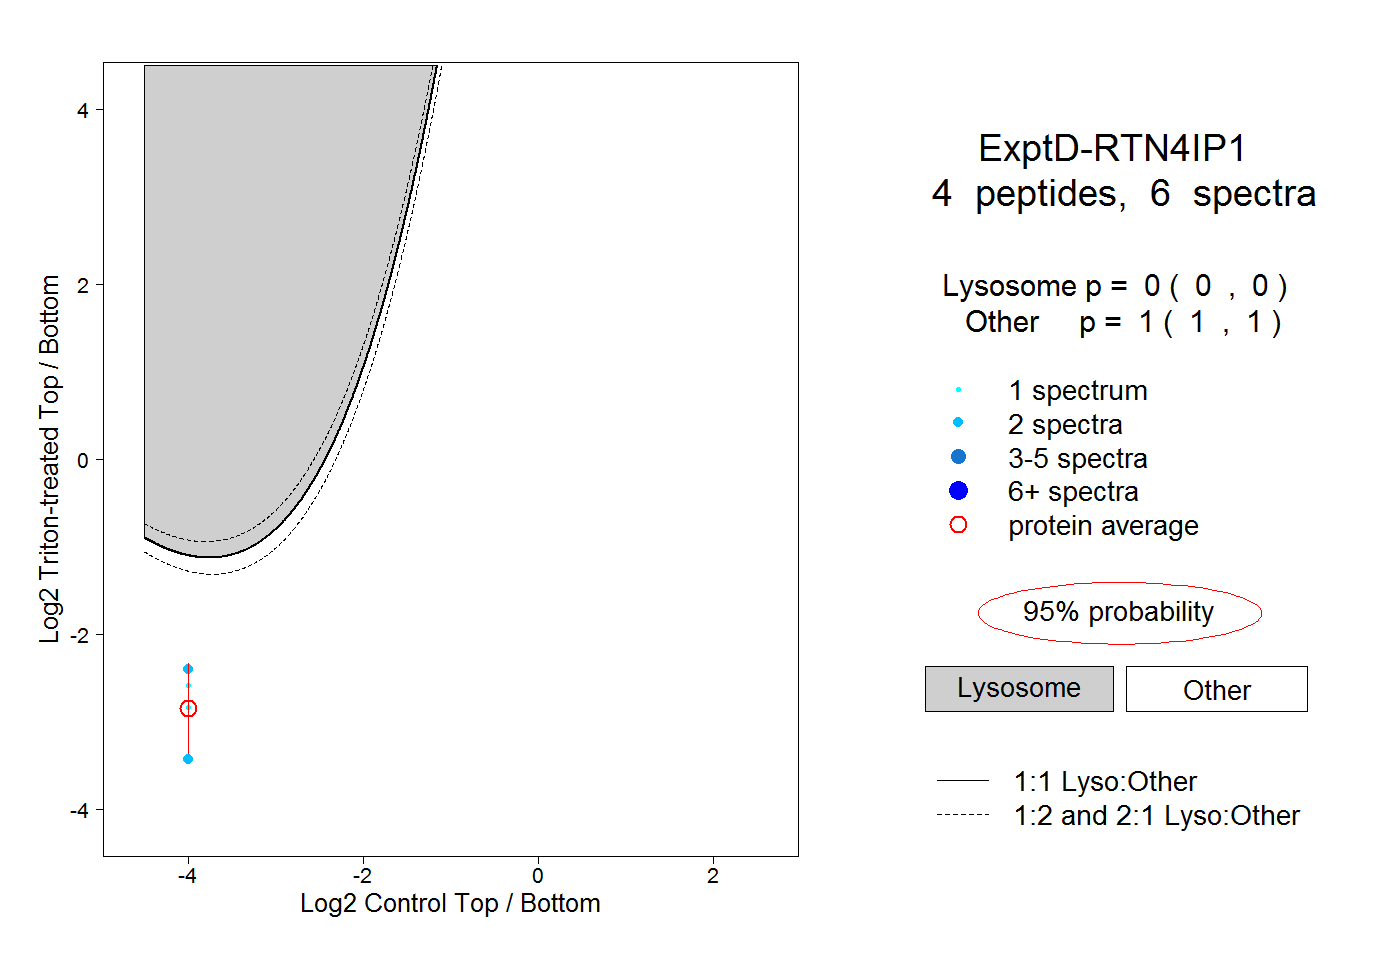 |
0.000 0.000 | 0.000 |
1.000 1.000 | 1.000 |