 7
7peptides
spectra
0.000 | 0.000
0.000 | 0.000
0.000 | 0.000
0.270 | 0.289
0.000 | 0.000
0.000 | 0.000
0.267 | 0.286
0.428 | 0.453
4peptides
spectra
0.000 | 0.000
1.000 | 1.000
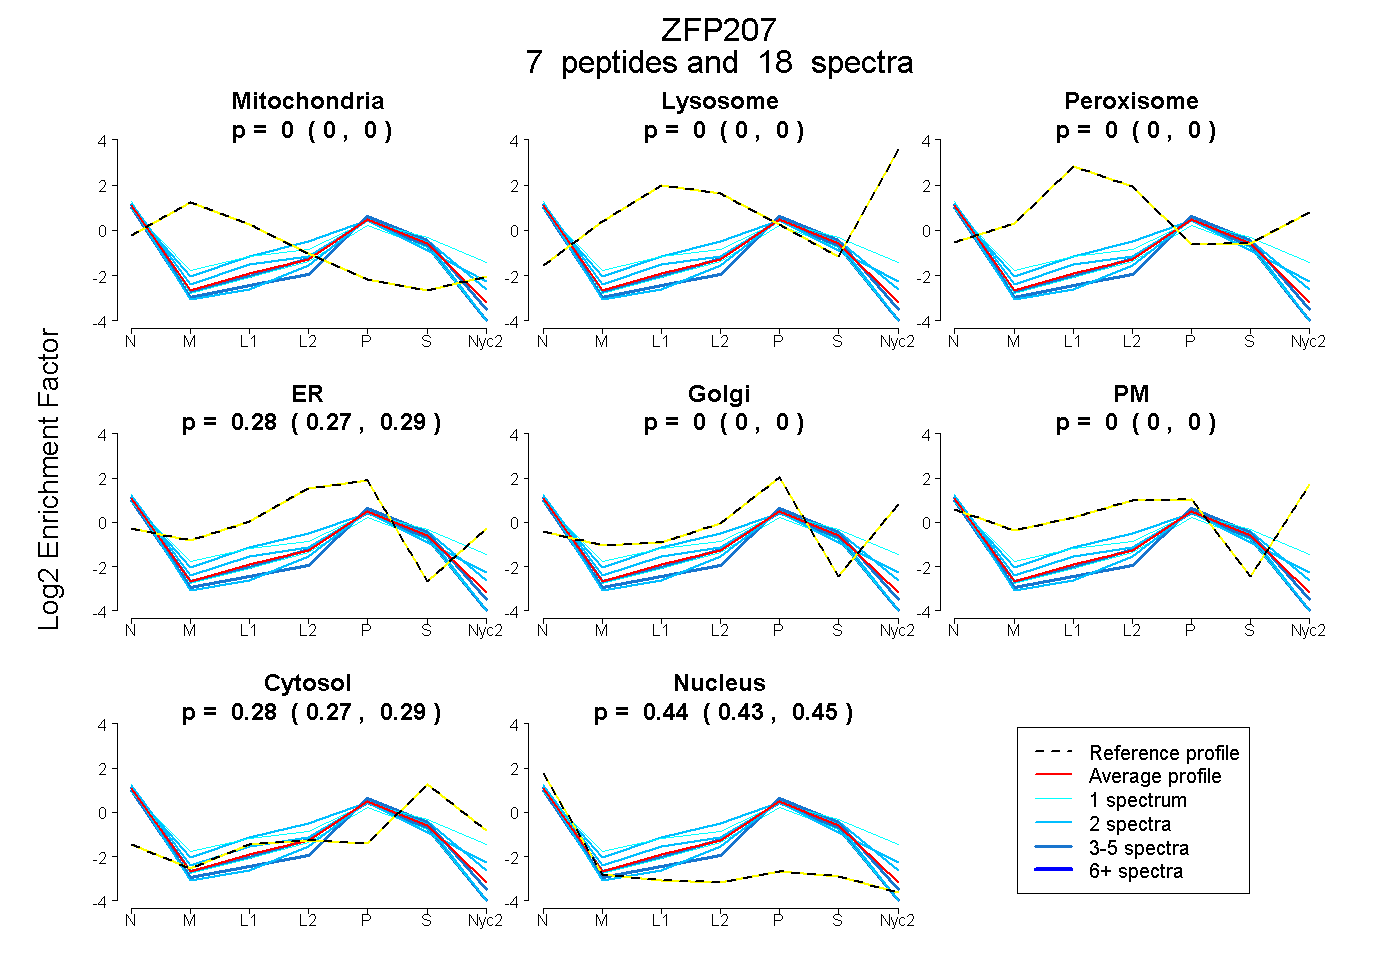
| Plot | Mito | Lyso | Perox | ER | Golgi | PM | Cytosol | Nucleus | |||||
| Expt A |
7 peptides |
18 spectra |
|
0.000 0.000 | 0.000 |
0.000 0.000 | 0.000 |
0.000 0.000 | 0.000 |
0.280 0.270 | 0.289 |
0.000 0.000 | 0.000 |
0.000 0.000 | 0.000 |
0.278 0.267 | 0.286 |
0.442 0.428 | 0.453 |
||
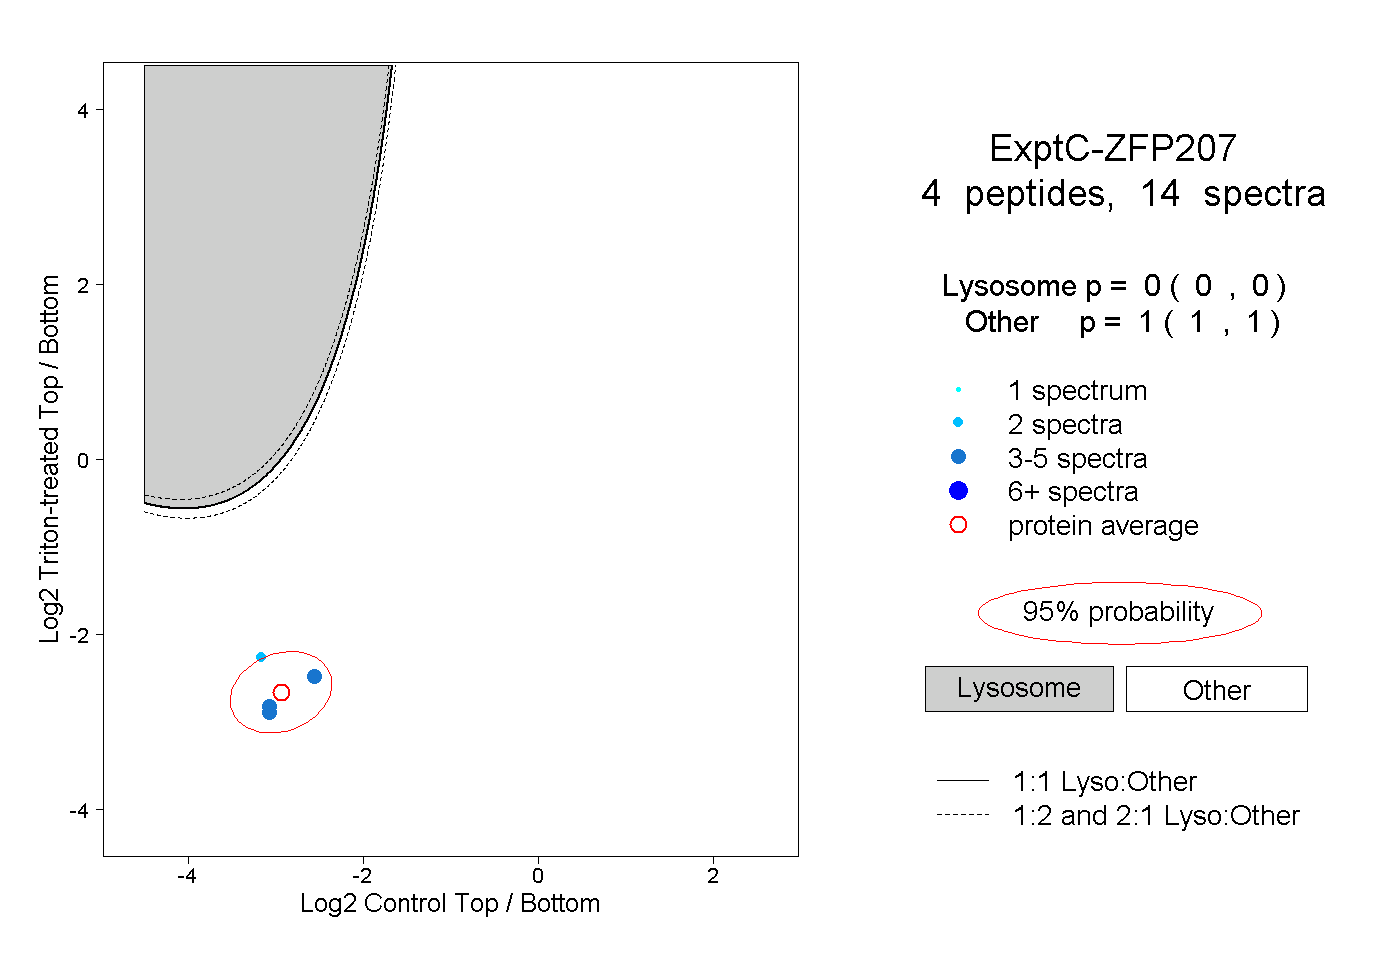
| Plot | Lyso | Other | |||||||||||
| Expt C |
4 peptides |
14 spectra |
|
0.000 0.000 | 0.000 |
1.000 1.000 | 1.000 |
| 2 spectra, ETIDAVPNAIPGR | 0.000 | 1.000 | ||||||||
| 4 spectra, DFDDEK | 0.000 | 1.000 | ||||||||
| 3 spectra, ILIQHQK | 0.000 | 1.000 | ||||||||
| 5 spectra, TQESQK | 0.000 | 1.000 |
| Plot | Lyso | Other | |||||||||||
| Expt D |
1 peptide |
1 spectrum |
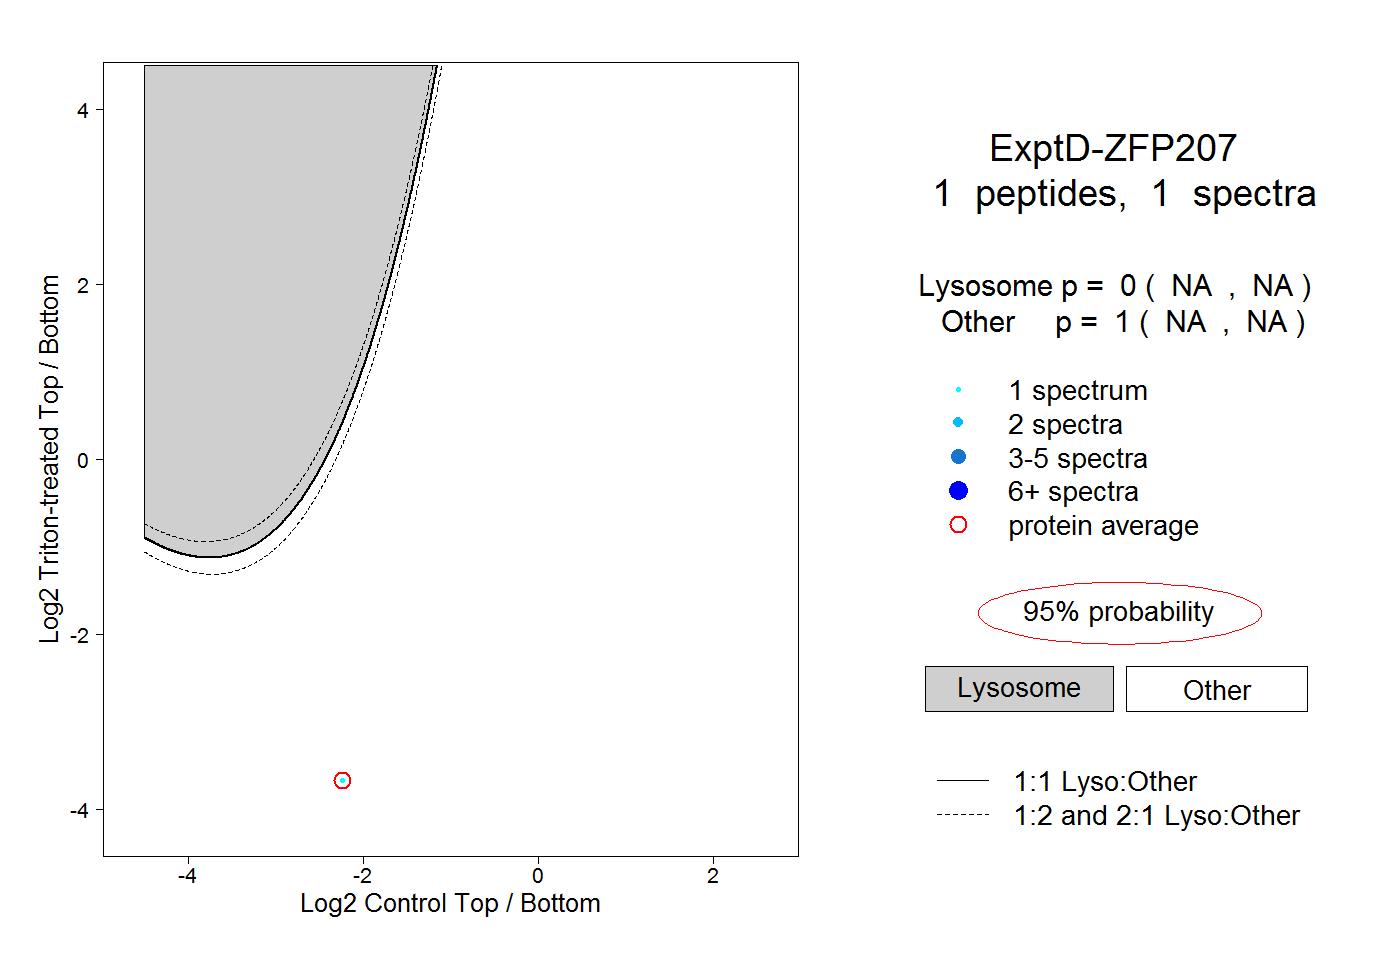 |
0.000 NA | NA |
1.000 NA | NA |