 2
2peptides
spectra
0.000 | 0.000
0.696 | 0.775
0.000 | 0.000
0.000 | 0.000
0.000 | 0.000
0.109 | 0.181
0.093 | 0.128
0.000 | 0.000
1peptide
spectrum
NA | NA
NA | NA
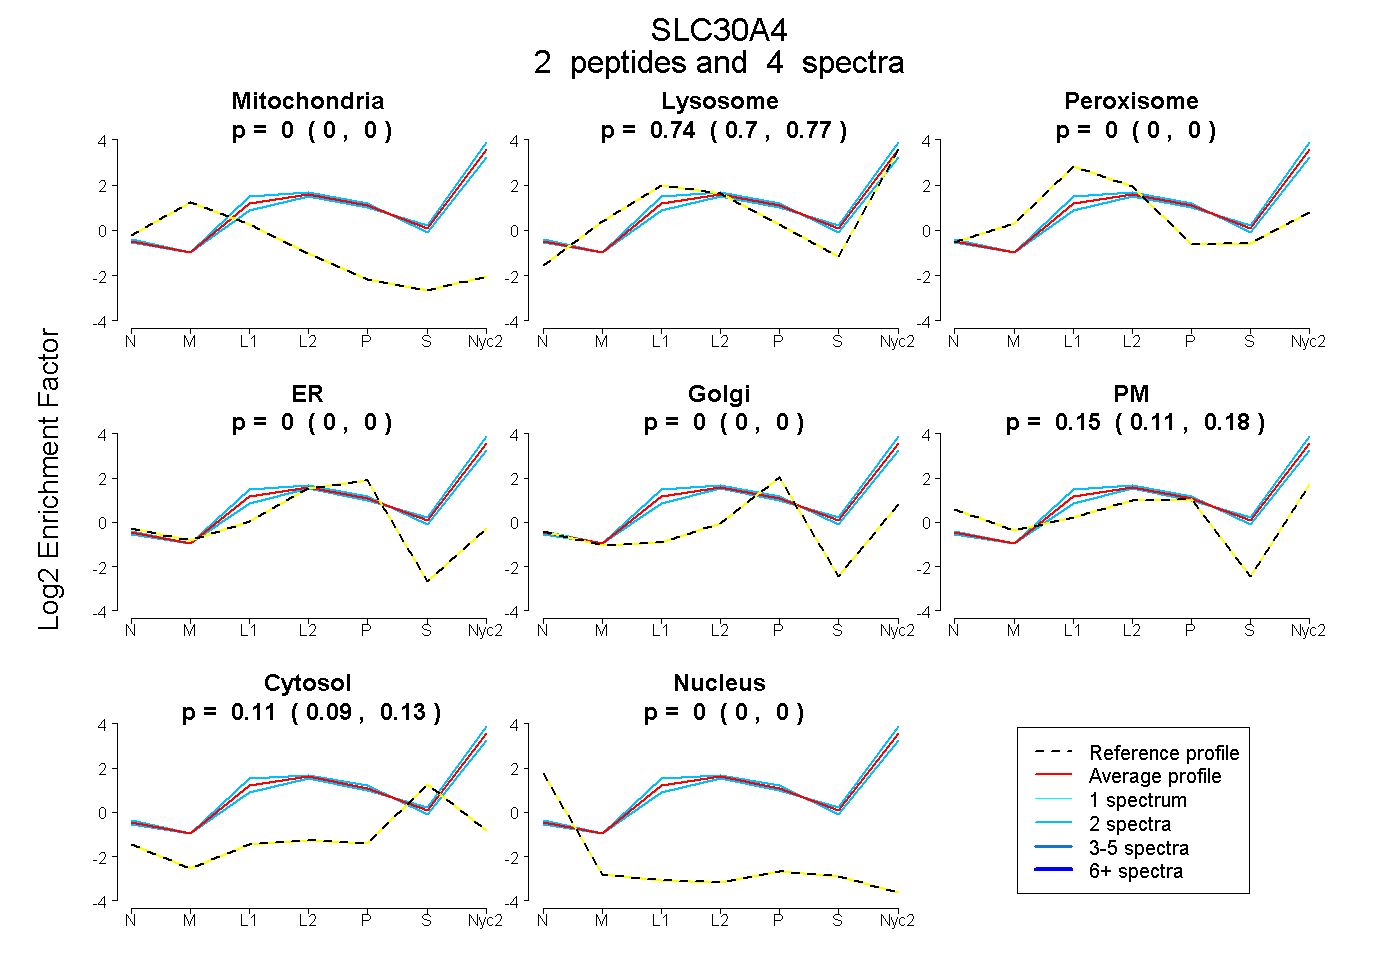
| Plot | Mito | Lyso | Perox | ER | Golgi | PM | Cytosol | Nucleus | |||||
| Expt A |
2 peptides |
4 spectra |
|
0.000 0.000 | 0.000 |
0.738 0.696 | 0.775 |
0.000 0.000 | 0.000 |
0.000 0.000 | 0.000 |
0.000 0.000 | 0.000 |
0.150 0.109 | 0.181 |
0.112 0.093 | 0.128 |
0.000 0.000 | 0.000 |
||
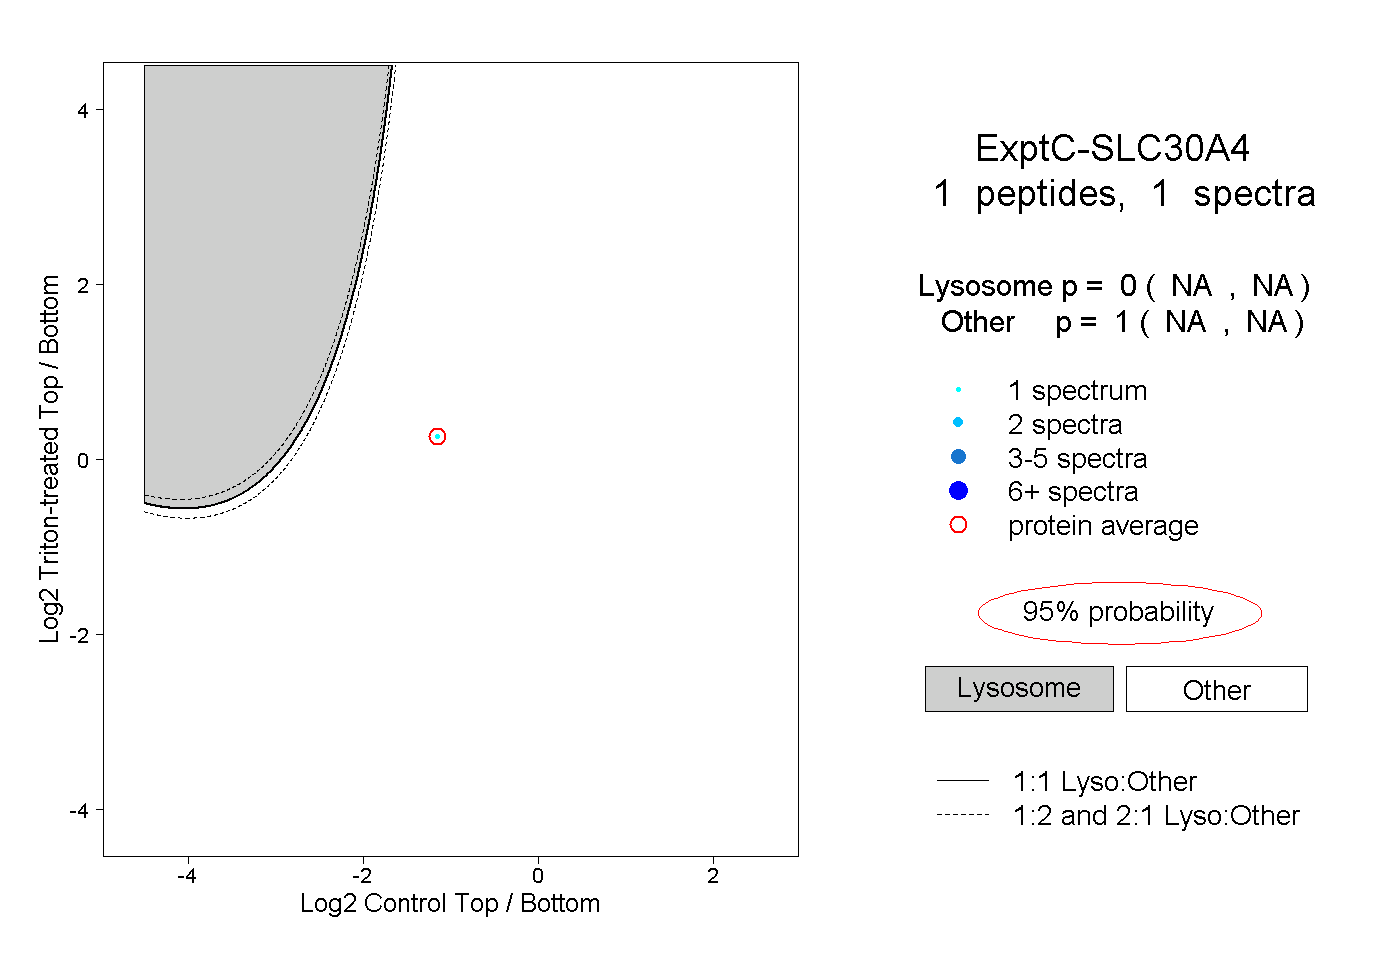
| Plot | Lyso | Other | |||||||||||
| Expt C |
1 peptide |
1 spectrum |
|
0.000 NA | NA |
1.000 NA | NA |