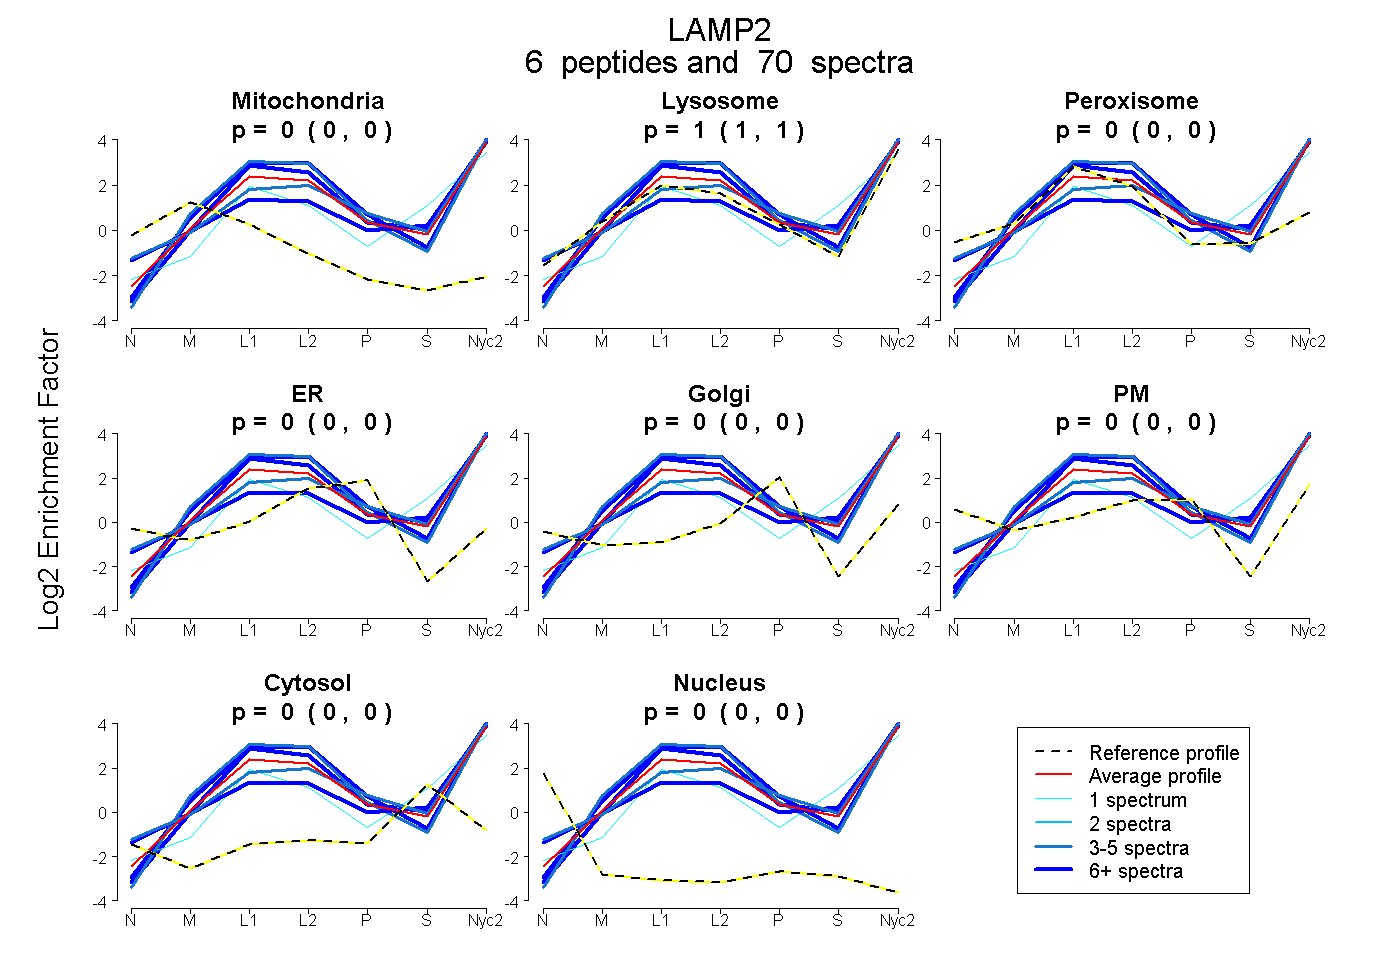
LAMP2
[ENSRNOP00000000177]
Main page
| | | Plot |
Mito |
Lyso |
|
Perox |
ER |
Golgi |
PM |
Cytosol |
Nucleus |
|
| Expt A |
 6
6
peptides |
70
spectra |
 |
0.000
0.000 | 0.000 |
1.000
1.000 | 1.000 |
|
0.000
0.000 | 0.000 |
0.000
0.000 | 0.000 |
0.000
0.000 | 0.000 |
0.000
0.000 | 0.000 |
0.000
0.000 | 0.000 |
0.000
0.000 | 0.000 |
|
| | | Plot |
Mito |
|
Lyso or Perox |
|
ER |
Golgi |
PM |
Cytosol |
Nucleus |
|
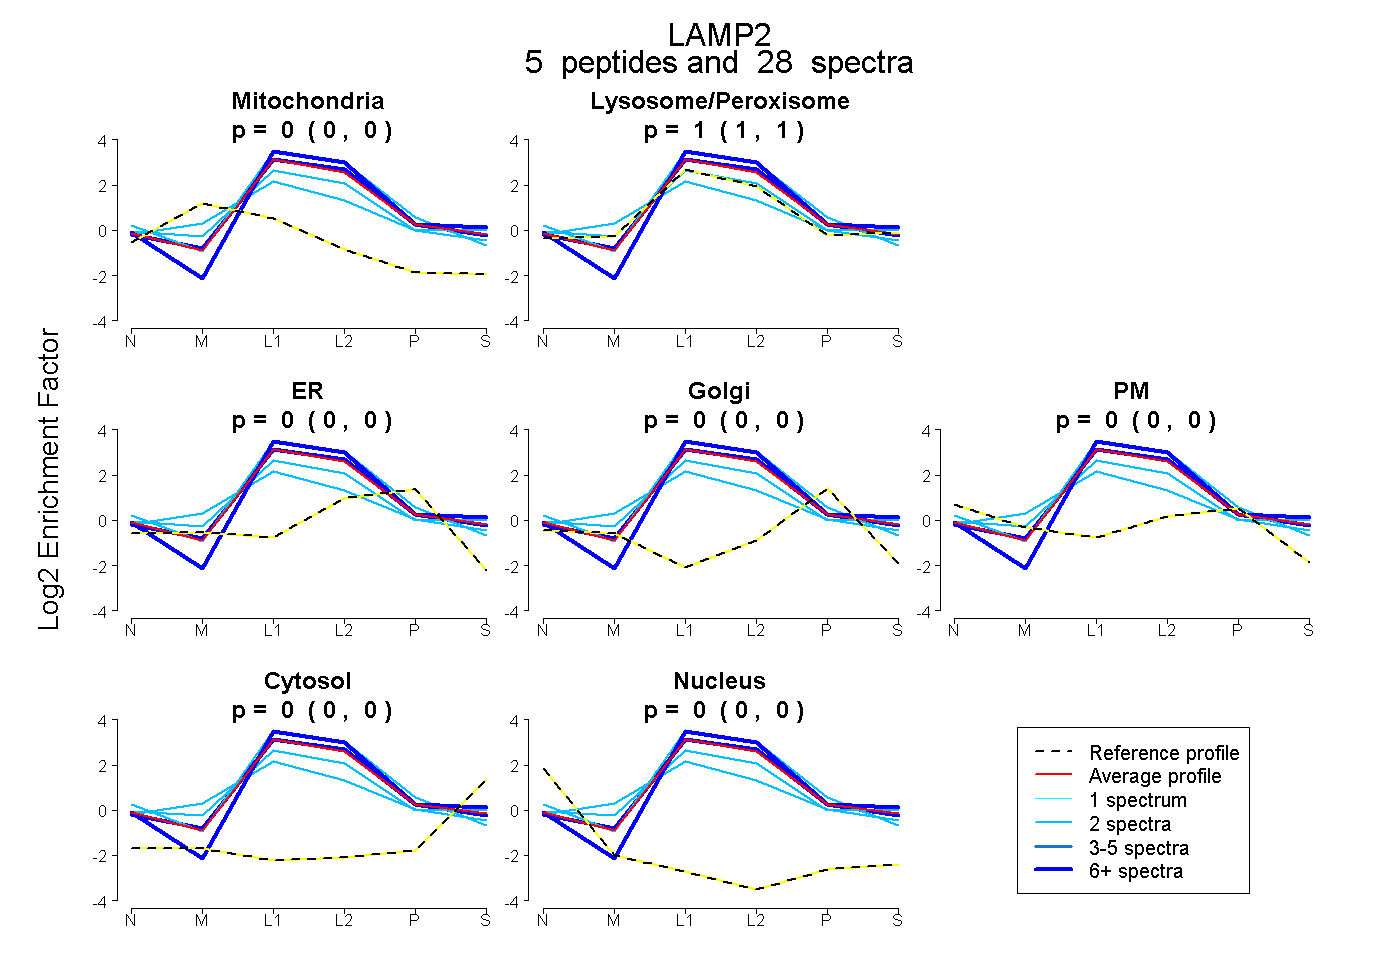
| Expt B |
5
peptides |
28
spectra |
 |
0.000
0.000 | 0.000 |
|
1.000
1.000 | 1.000 |
|
0.000
0.000 | 0.000 |
0.000
0.000 | 0.000 |
0.000
0.000 | 0.000 |
0.000
0.000 | 0.000 |
0.000
0.000 | 0.000 |
|
| | | Plot |
|
Lyso |
|
|
|
|
|
|
|
Other |
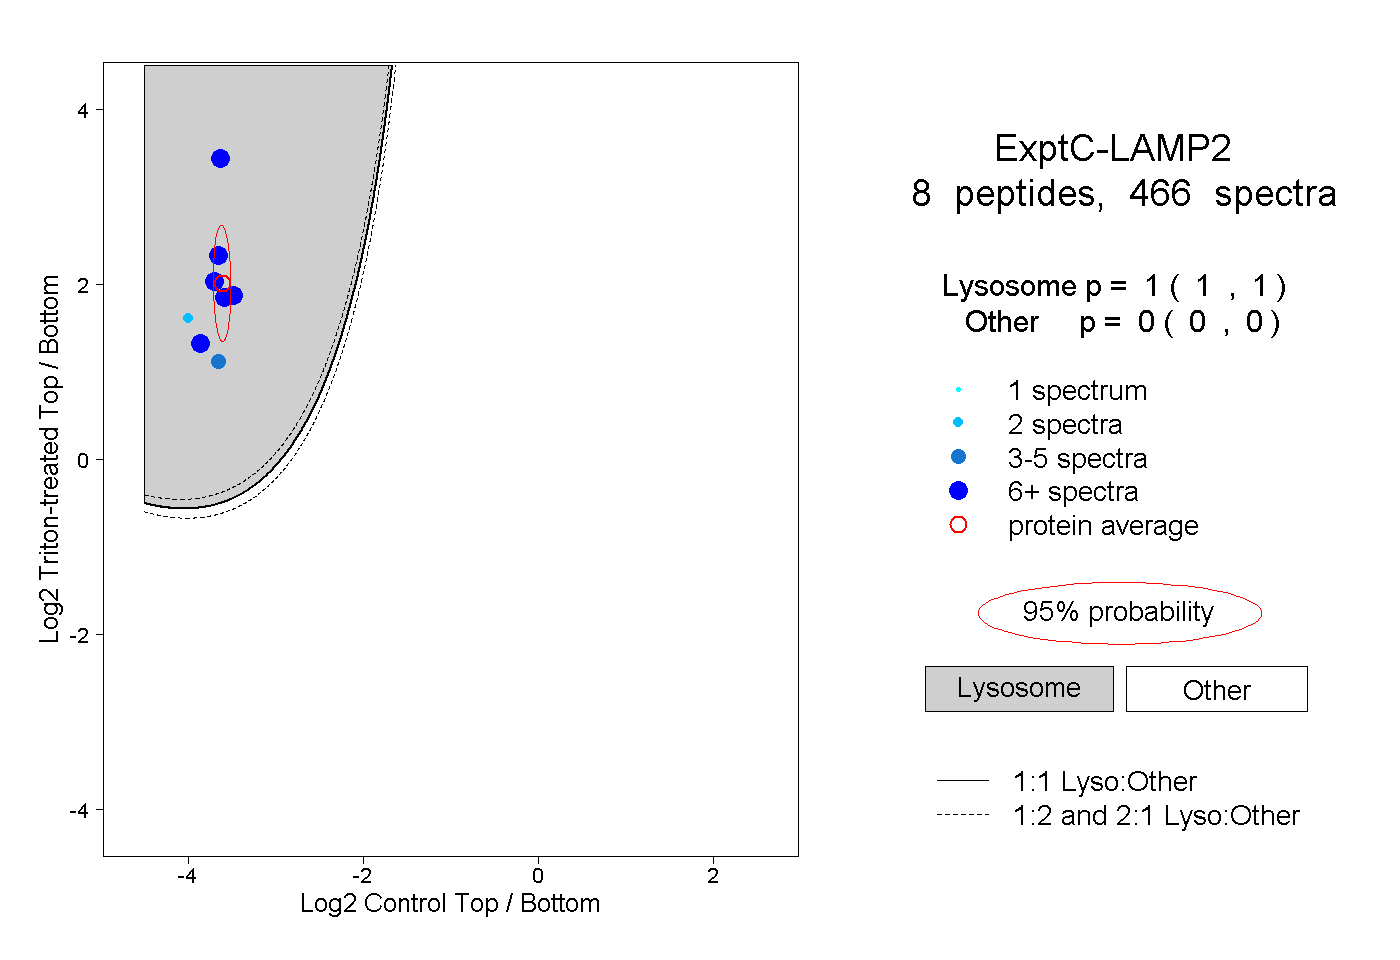
| Expt C |
8
peptides |
466
spectra |
 |
|
1.000
1.000 | 1.000 |
|
|
|
|
|
|
|
0.000
0.000 | 0.000 |
| 94 spectra, HEQVCK |
|
1.000 |
|
|
|
|
|
|
|
0.000 |
| 7 spectra, LNLTDSK |
|
1.000 |
|
|
|
|
|
|
|
0.000 |
| 38 spectra, TFQINTFNLK |
|
1.000 |
|
|
|
|
|
|
|
0.000 |
| 146 spectra, TFPGAVPK |
|
1.000 |
|
|
|
|
|
|
|
0.000 |
| 3 spectra, VQPFNVTK |
|
1.000 |
|
|
|
|
|
|
|
0.000 |
| 22 spectra, YLDFIFAVK |
|
1.000 |
|
|
|
|
|
|
|
0.000 |
| 154 spectra, EQVVSVSR |
|
1.000 |
|
|
|
|
|
|
|
0.000 |
| 2 spectra, LNNSQIK |
|
1.000 |
|
|
|
|
|
|
|
0.000 |
| | | Plot |
|
Lyso |
|
|
|
|
|
|
|
Other |
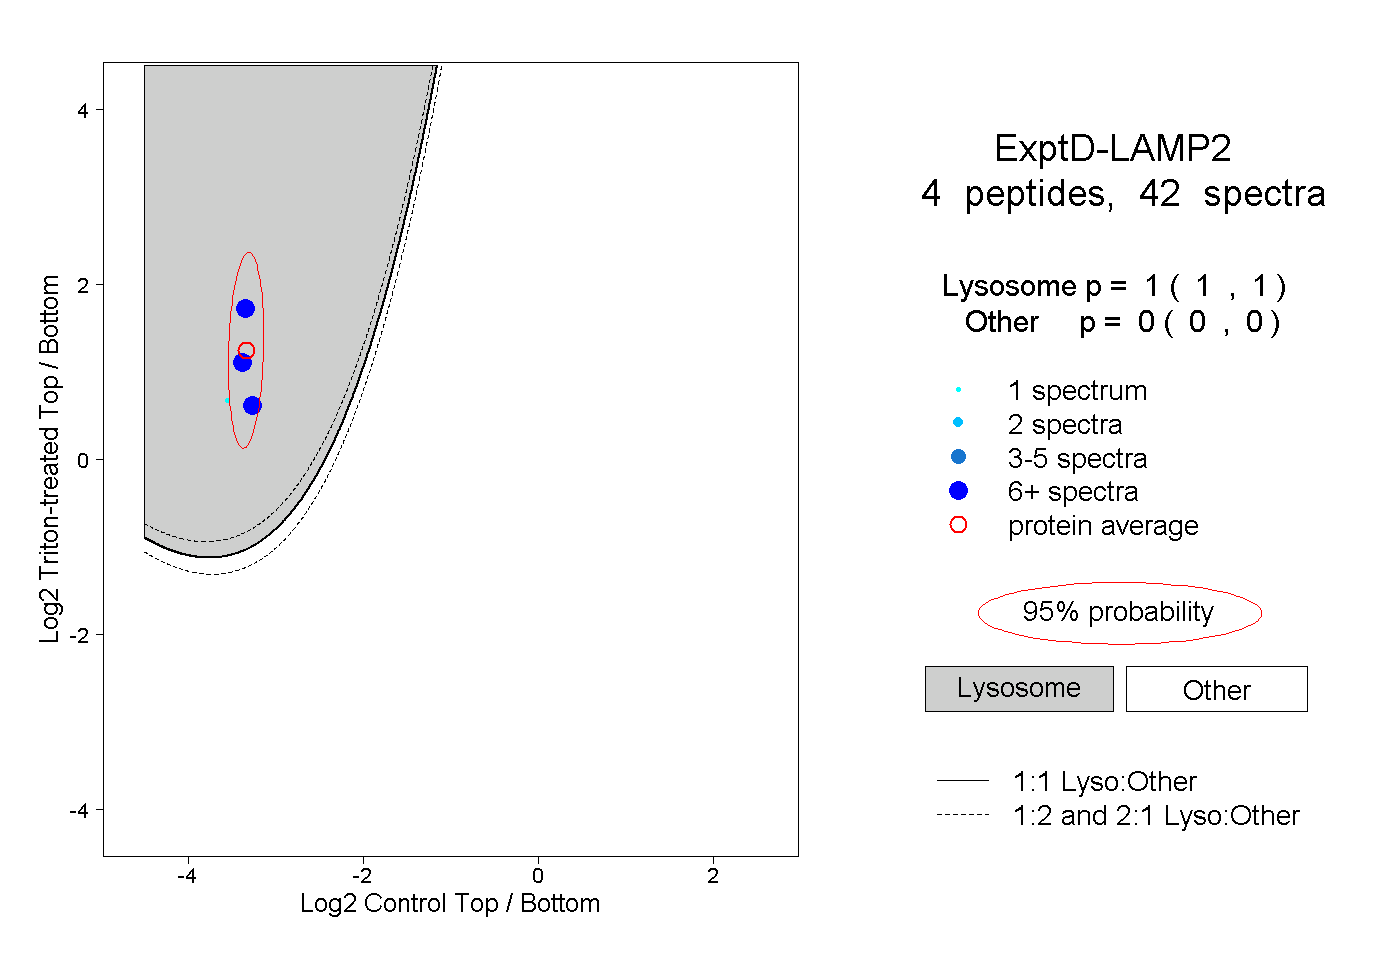
| Expt D |
4
peptides |
42
spectra |
 |
|
1.000
1.000 | 1.000 |
|
|
|
|
|
|
|
0.000
0.000 | 0.000 |