 5
5peptides
spectra
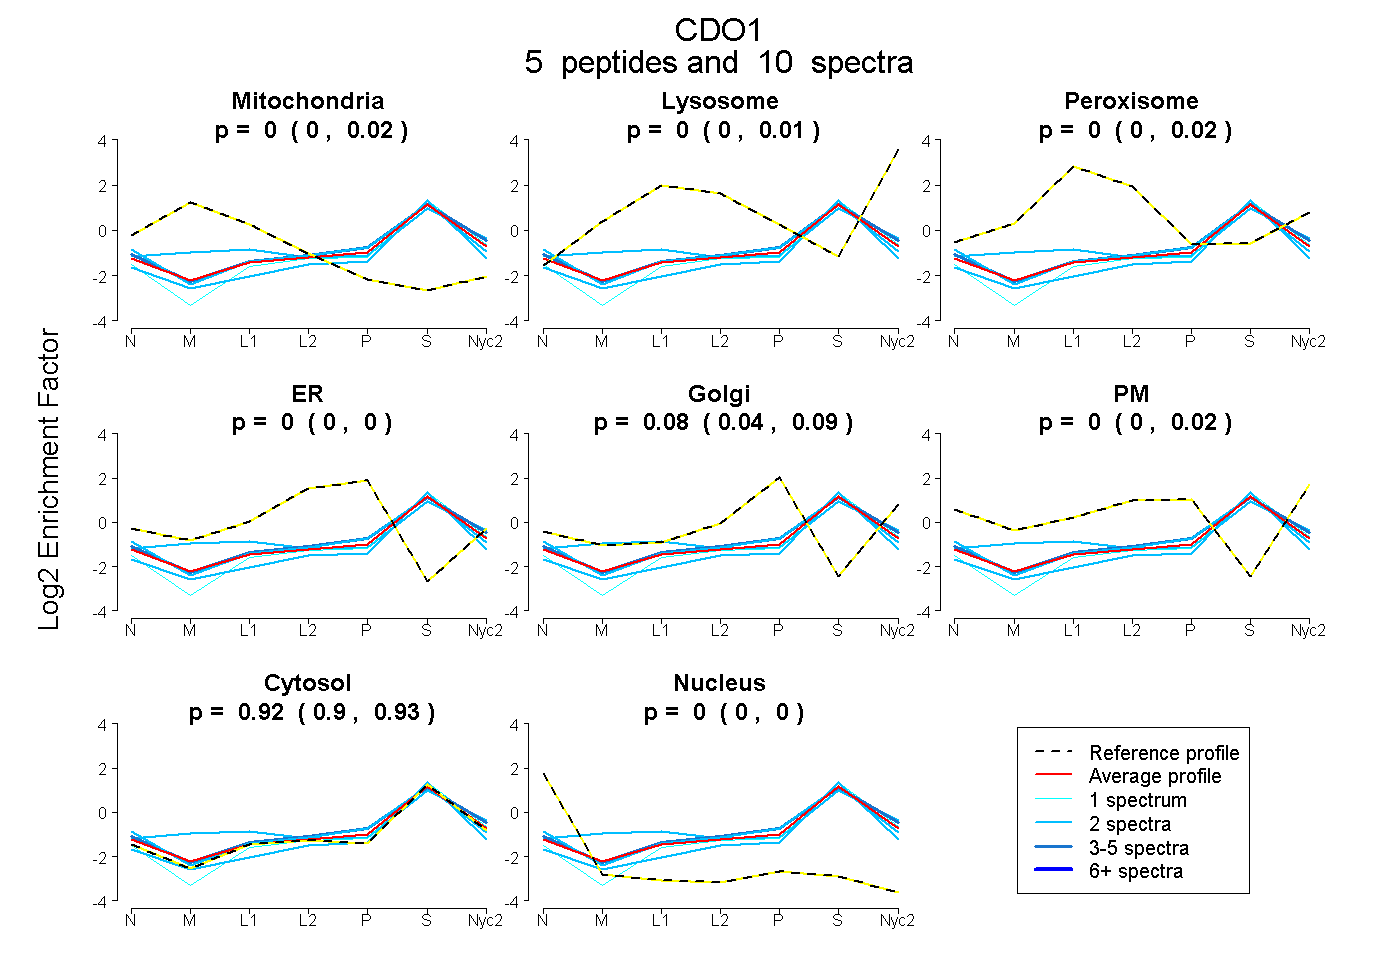
0.000 | 0.019
0.000 | 0.012
0.000 | 0.017
0.000 | 0.000
0.040 | 0.088
0.000 | 0.024
0.895 | 0.931
0.000 | 0.000
1peptide
spectrum
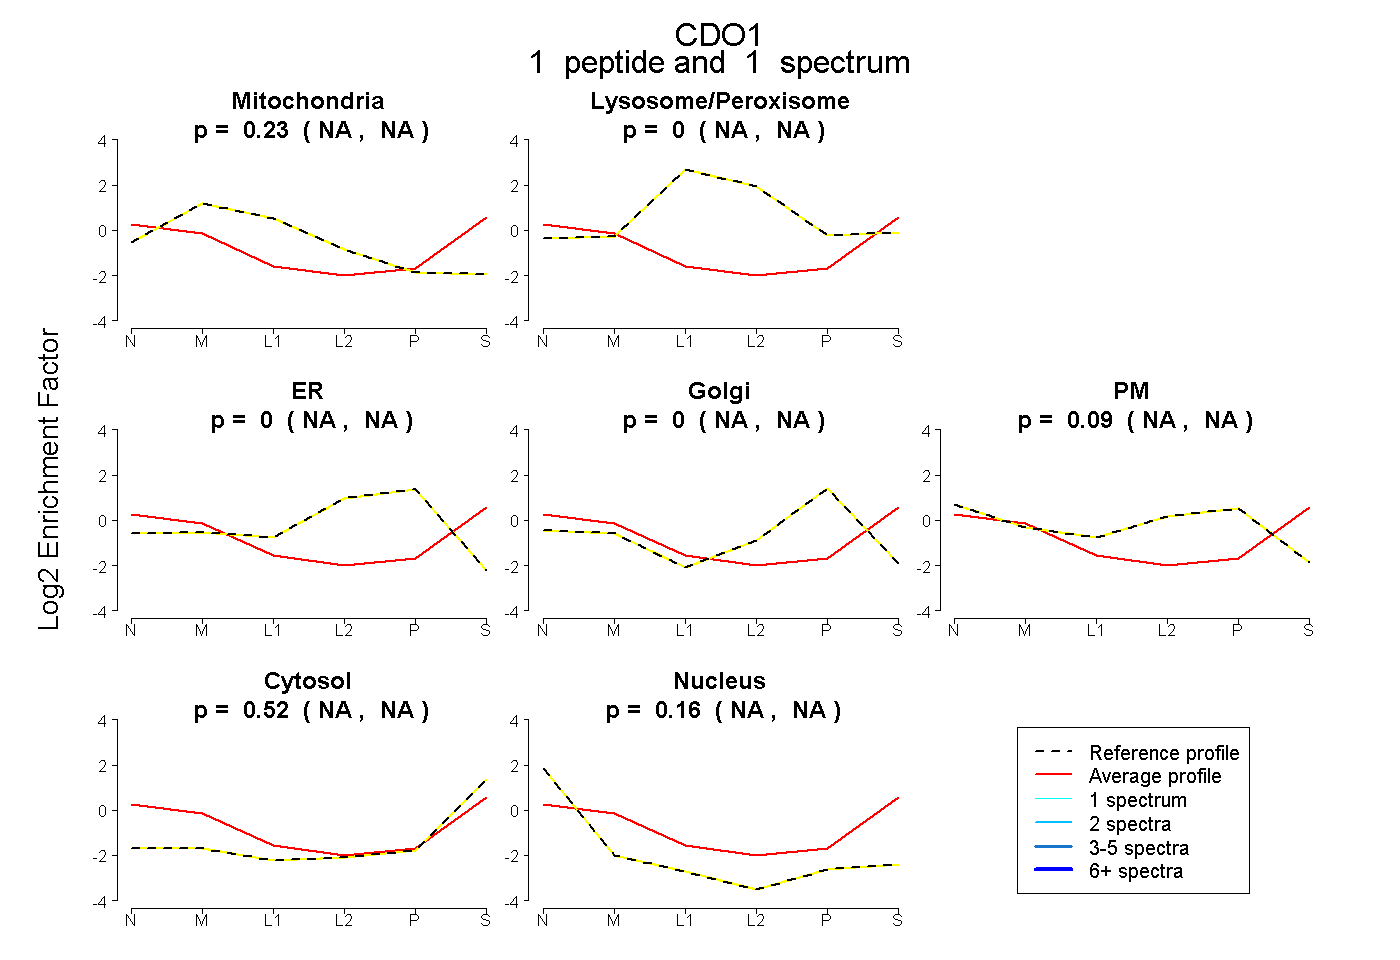
NA | NA
NA | NA
NA | NA
NA | NA
NA | NA
NA | NA
NA | NA
3peptides
spectra

0.000 | 0.000
1.000 | 1.000