 4
4peptides
spectra
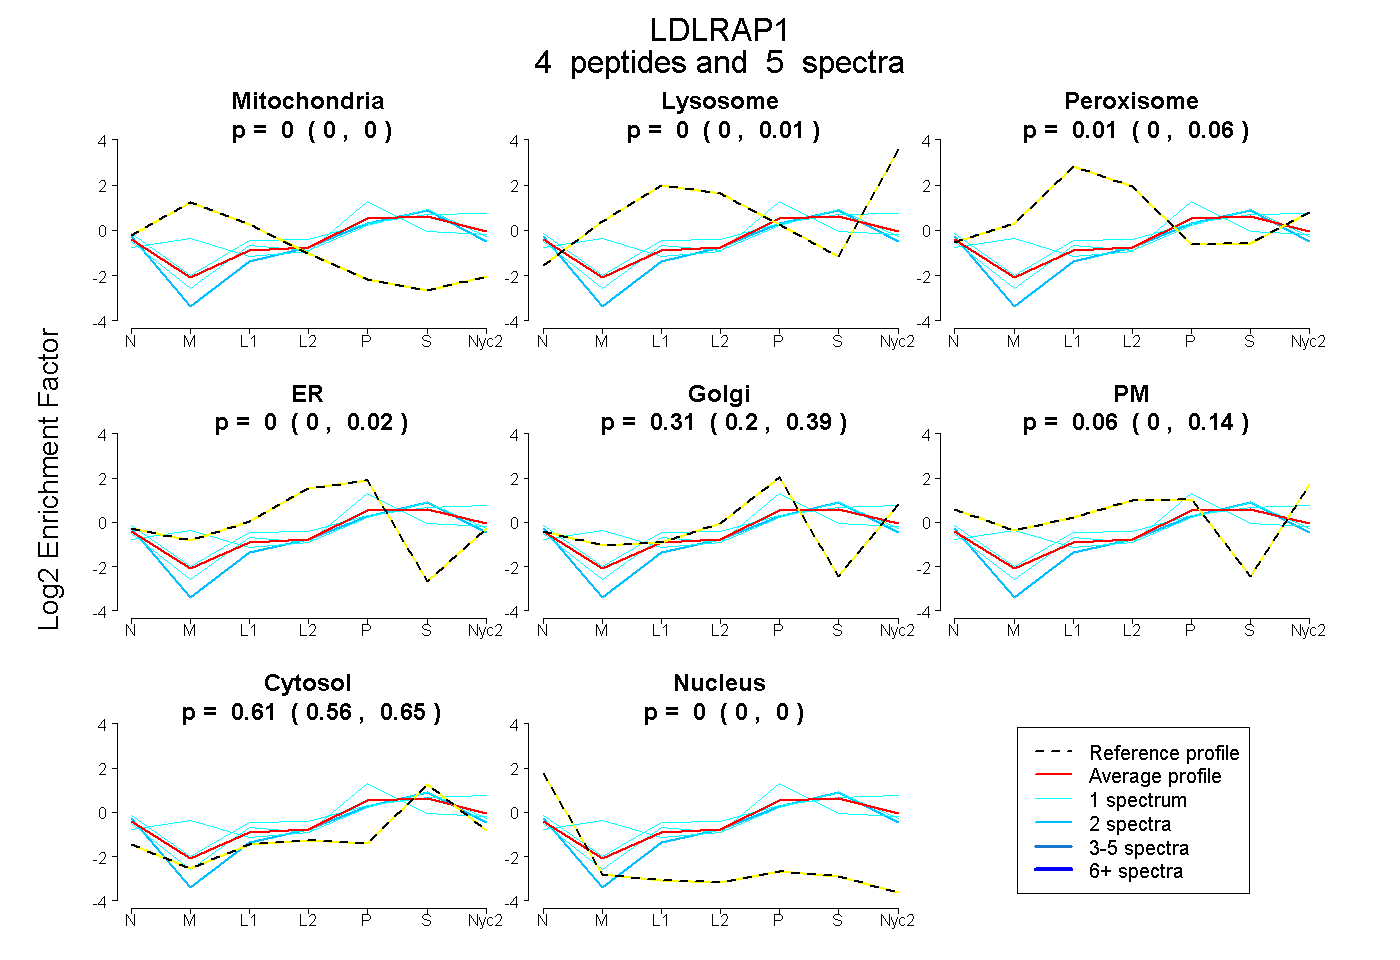
0.000 | 0.000
0.000 | 0.010
0.000 | 0.062
0.000 | 0.015
0.202 | 0.392
0.000 | 0.135
0.557 | 0.650
0.000 | 0.000
| Plot | Mito | Lyso | Perox | ER | Golgi | PM | Cytosol | Nucleus | |||||
| Expt A |
4 peptides |
5 spectra |
|
0.000 0.000 | 0.000 |
0.000 0.000 | 0.010 |
0.011 0.000 | 0.062 |
0.000 0.000 | 0.015 |
0.312 0.202 | 0.392 |
0.065 0.000 | 0.135 |
0.612 0.557 | 0.650 |
0.000 0.000 | 0.000 |
| 1 spectrum, LPENWTDTR | 0.000 | 0.067 | 0.000 | 0.000 | 0.000 | 0.347 | 0.586 | 0.000 | ||
| 1 spectrum, GEELSAAAVK | 0.000 | 0.000 | 0.046 | 0.000 | 0.252 | 0.000 | 0.703 | 0.000 | ||
| 2 spectra, ANQEGGDVPGTR | 0.000 | 0.000 | 0.000 | 0.000 | 0.249 | 0.000 | 0.751 | 0.000 | ||
| 1 spectrum, YLGMTLVERPK | 0.044 | 0.000 | 0.010 | 0.000 | 0.563 | 0.000 | 0.383 | 0.000 |
| Plot | Lyso | Other | |||||||||||
| Expt C |
3 peptides |
9 spectra |
 |
0.000 0.000 | 0.000 |
1.000 1.000 | 1.000 |