 3
3peptides
spectra
0.000 | 0.130
0.000 | 0.357
0.000 | 0.552
0.000 | 0.402
0.000 | 0.369
0.000 | 0.045
0.073 | 0.443
0.000 | 0.000
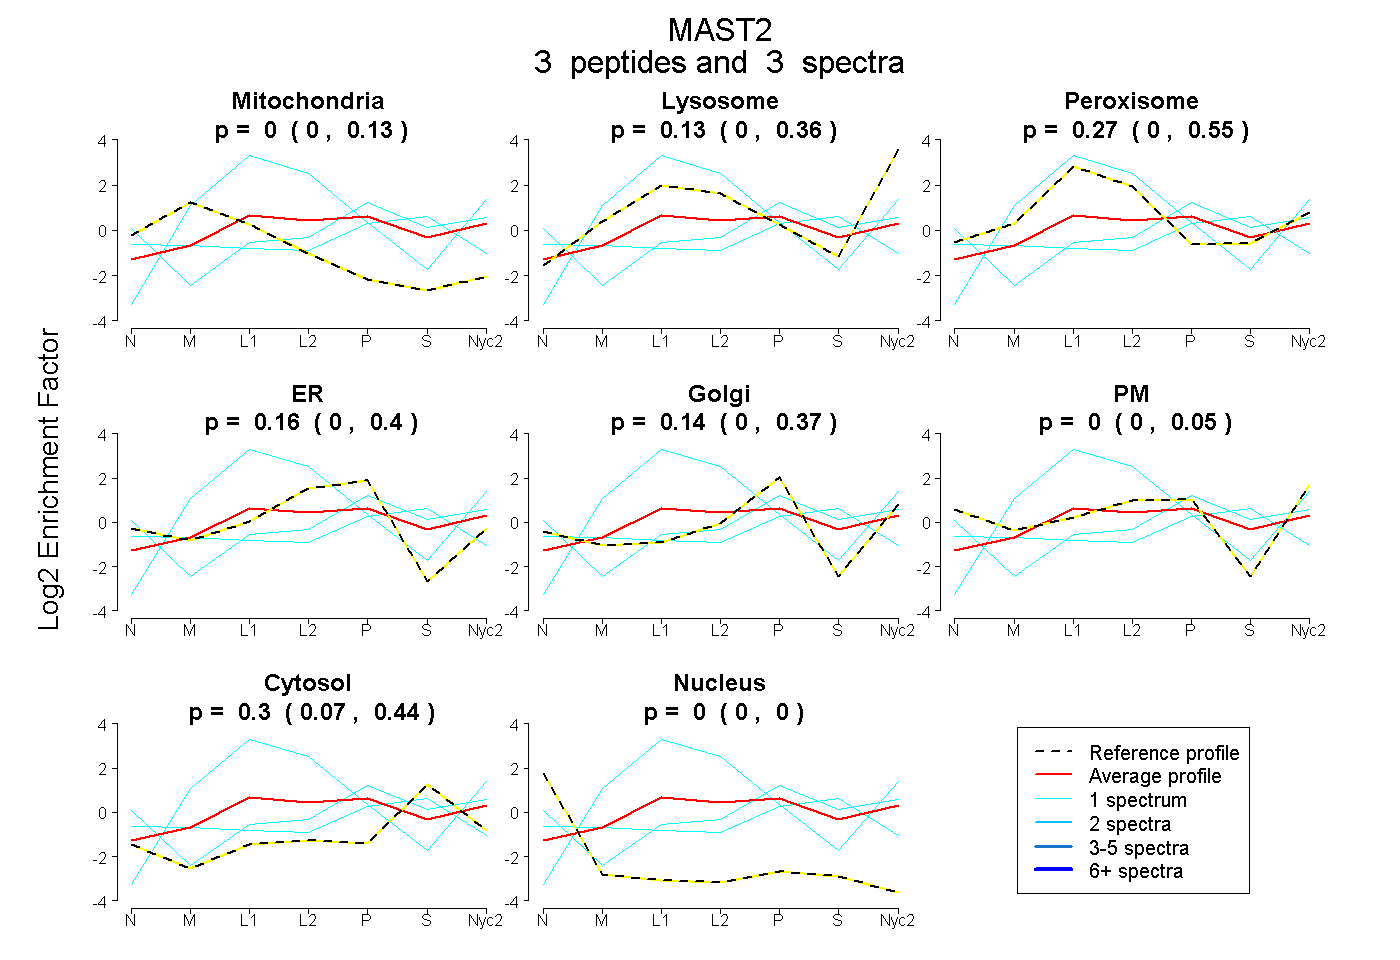
| Plot | Mito | Lyso | Perox | ER | Golgi | PM | Cytosol | Nucleus | |||||
| Expt A |
3 peptides |
3 spectra |
|
0.000 0.000 | 0.130 |
0.133 0.000 | 0.357 |
0.265 0.000 | 0.552 |
0.160 0.000 | 0.402 |
0.145 0.000 | 0.369 |
0.000 0.000 | 0.045 |
0.297 0.073 | 0.443 |
0.000 0.000 | 0.000 |
| 1 spectrum, LHLSPPLGR | 0.000 | 0.510 | 0.490 | 0.000 | 0.000 | 0.000 | 0.000 | 0.000 | ||
| 1 spectrum, YIVSQLGLTR | 0.000 | 0.000 | 0.000 | 0.000 | 0.344 | 0.208 | 0.448 | 0.000 | ||
| 1 spectrum, AISDLAVR | 0.115 | 0.000 | 0.053 | 0.087 | 0.178 | 0.000 | 0.567 | 0.000 |