 5
5peptides
spectra
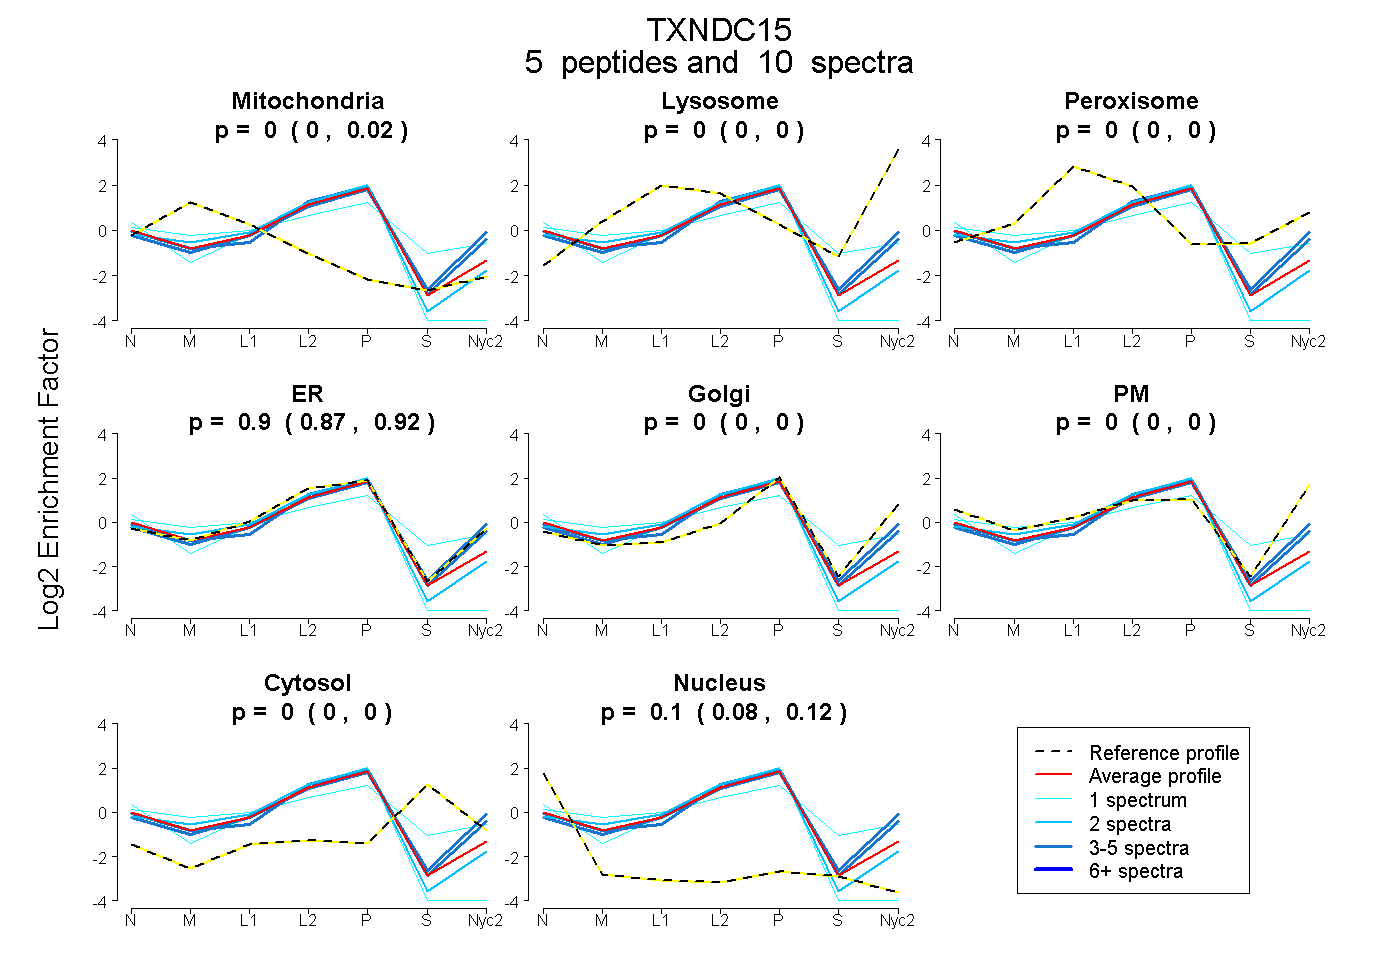
0.000 | 0.017
0.000 | 0.000
0.000 | 0.000
0.871 | 0.918
0.000 | 0.000
0.000 | 0.000
0.000 | 0.000
0.077 | 0.117
1peptide
spectra
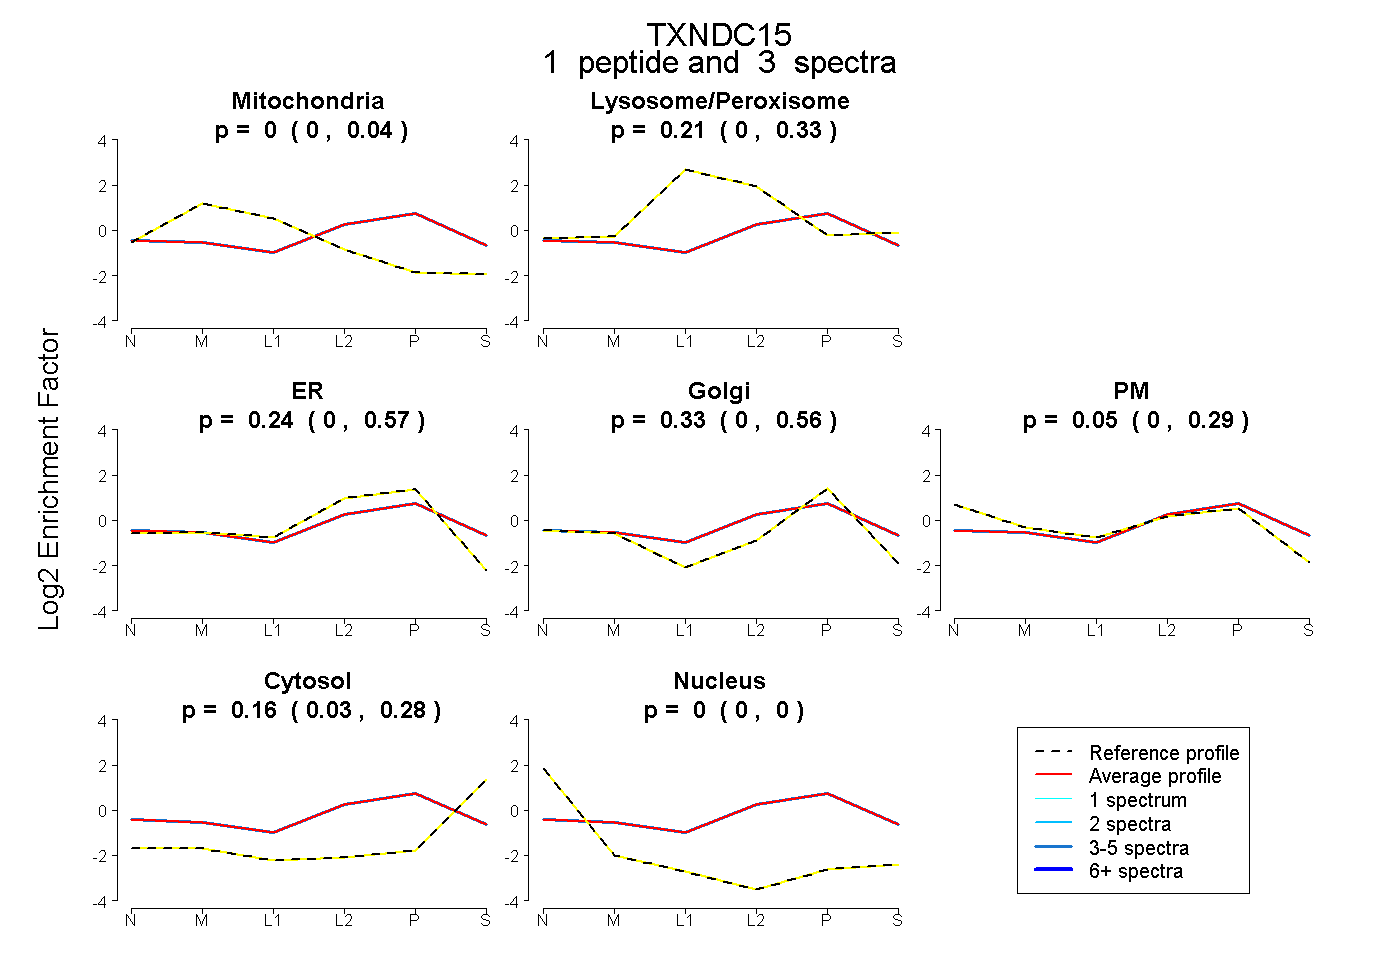
0.000 | 0.035
0.000 | 0.332
0.000 | 0.568
0.000 | 0.559
0.000 | 0.294
0.026 | 0.282
0.000 | 0.000
3peptides
spectra
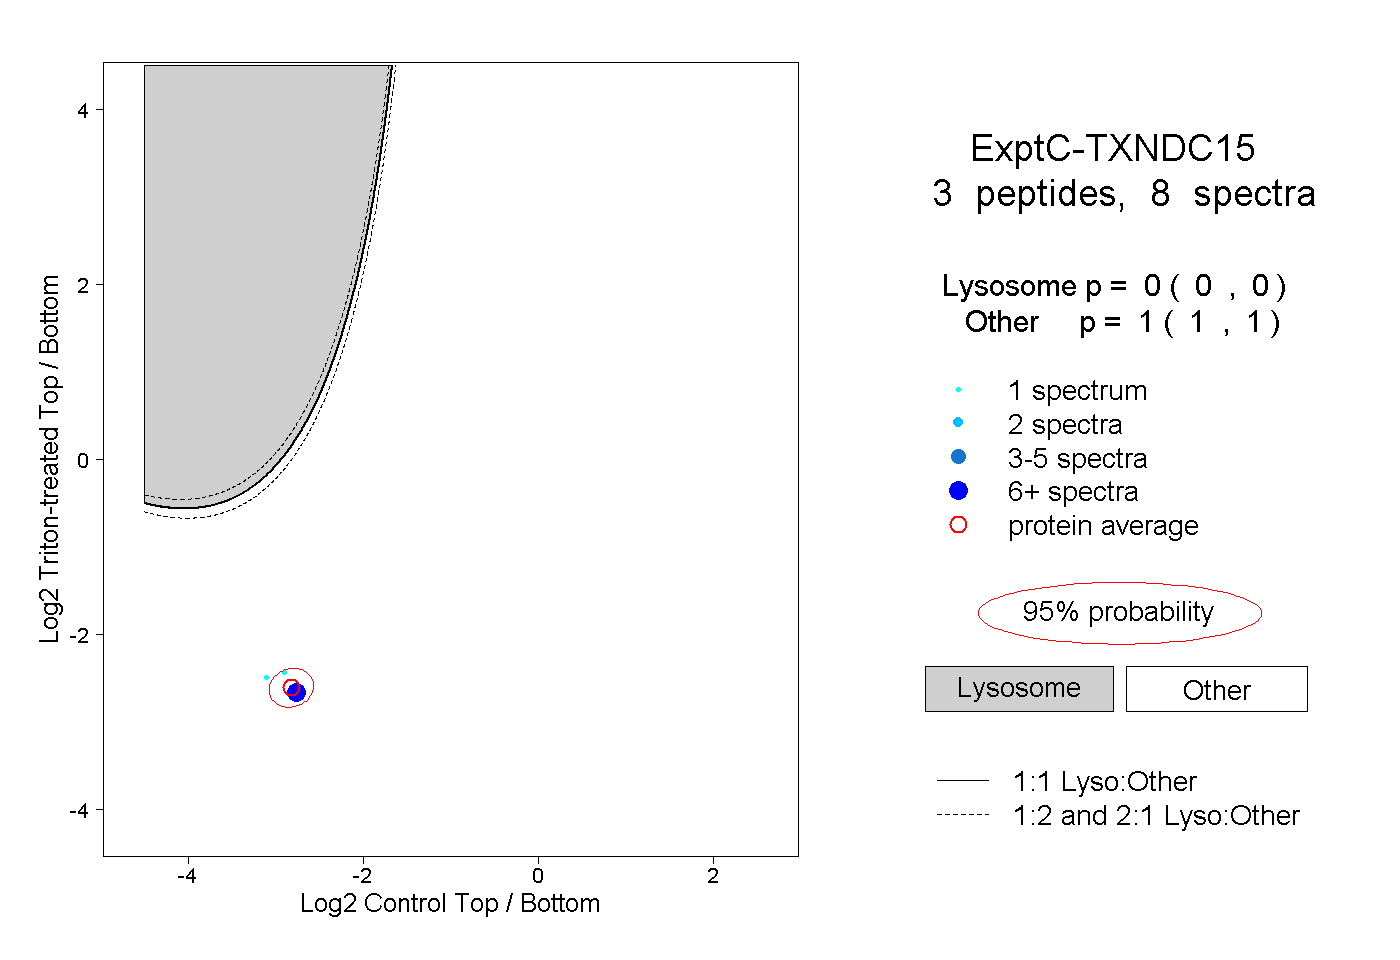
0.000 | 0.000
1.000 | 1.000
2peptides
spectra
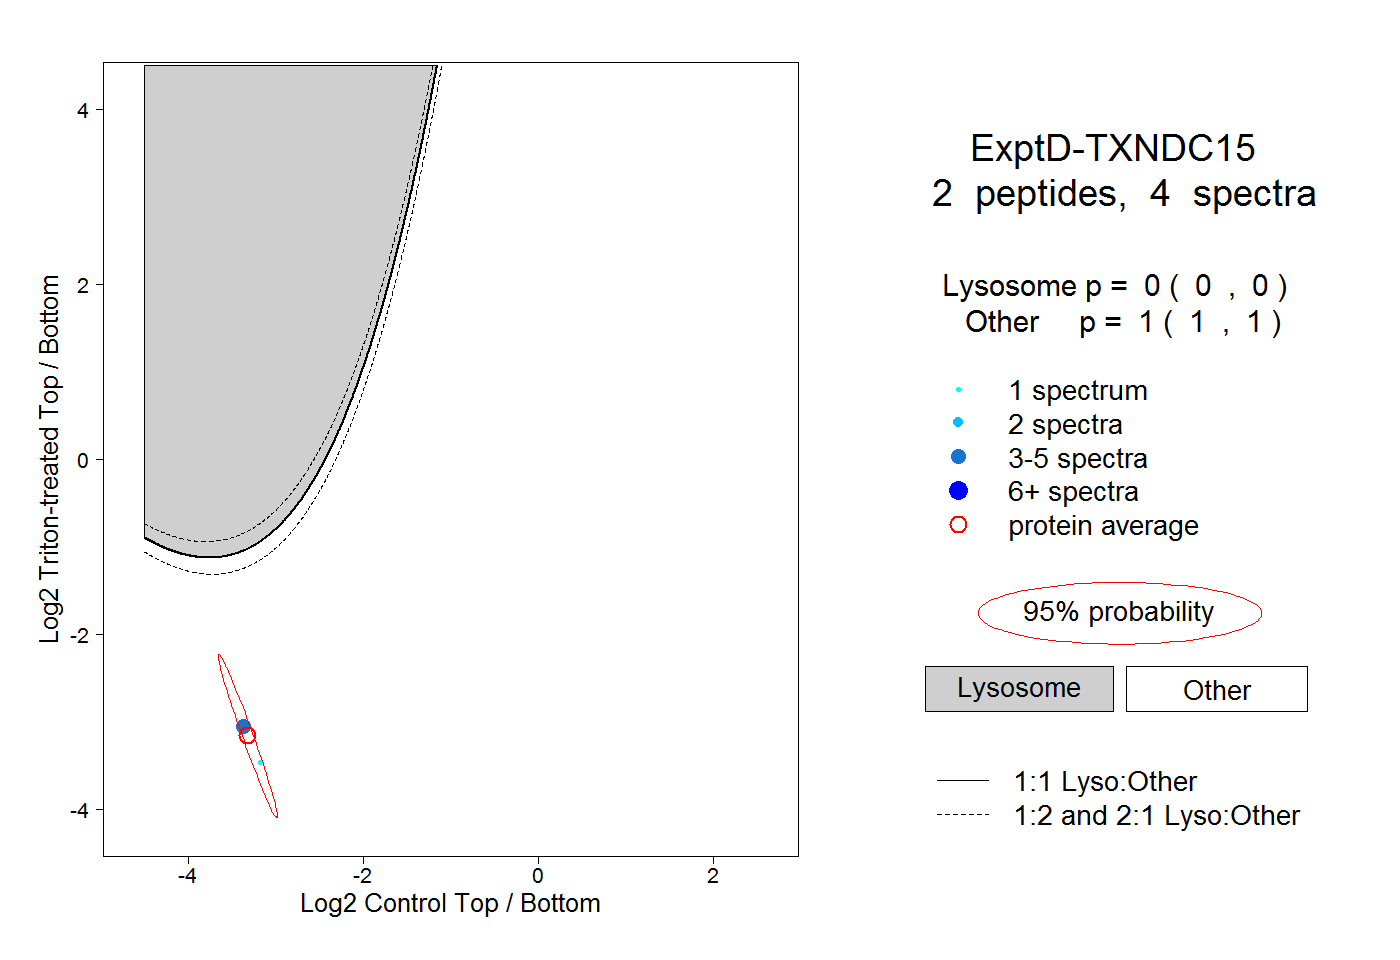
0.000 | 0.000
1.000 | 1.000