 5
5peptides
spectra
0.000 | 0.017
0.000 | 0.000
0.000 | 0.000
0.871 | 0.918
0.000 | 0.000
0.000 | 0.000
0.000 | 0.000
0.077 | 0.117
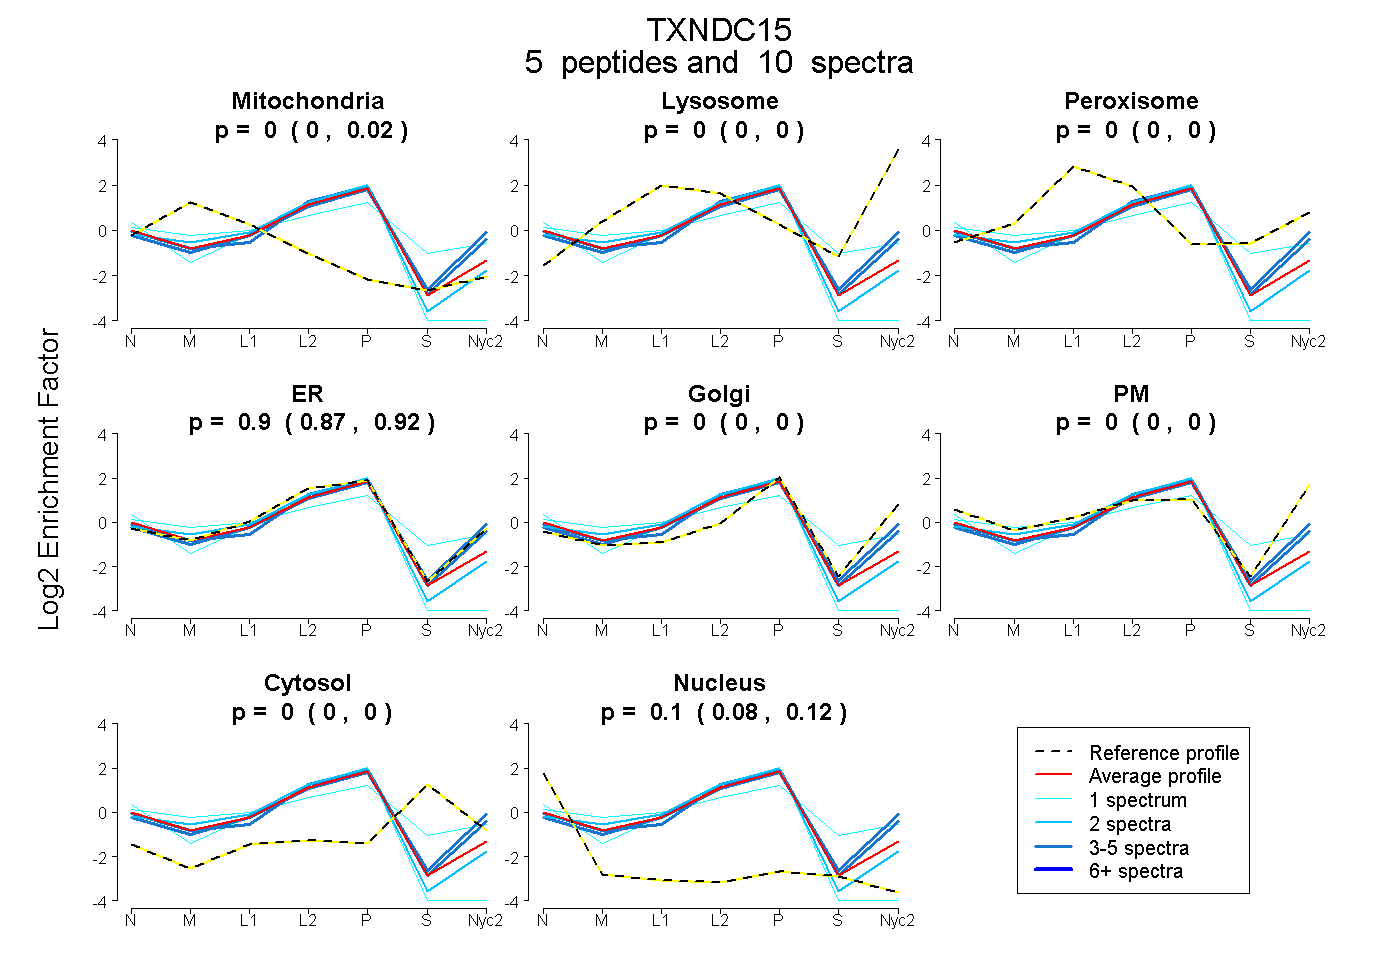
| Plot | Mito | Lyso | Perox | ER | Golgi | PM | Cytosol | Nucleus | |||||
| Expt A |
5 peptides |
10 spectra |
|
0.000 0.000 | 0.017 |
0.000 0.000 | 0.000 |
0.000 0.000 | 0.000 |
0.900 0.871 | 0.918 |
0.000 0.000 | 0.000 |
0.000 0.000 | 0.000 |
0.000 0.000 | 0.000 |
0.100 0.077 | 0.117 |
| 3 spectra, VAEPSEASLGPR | 0.000 | 0.000 | 0.000 | 0.739 | 0.214 | 0.015 | 0.000 | 0.032 | ||
| 1 spectrum, STEAHDGTCSAQGDEDPR | 0.000 | 0.000 | 0.000 | 0.769 | 0.000 | 0.000 | 0.000 | 0.231 | ||
| 2 spectra, WLIPGQEQEHAE | 0.043 | 0.000 | 0.000 | 0.886 | 0.000 | 0.000 | 0.000 | 0.071 | ||
| 1 spectrum, FSASLAPHFNSLPR | 0.079 | 0.000 | 0.133 | 0.539 | 0.085 | 0.000 | 0.164 | 0.000 | ||
| 3 spectra, VNCEER | 0.000 | 0.000 | 0.000 | 0.841 | 0.114 | 0.000 | 0.000 | 0.045 |
| Plot | Mito | Lyso or Perox | ER | Golgi | PM | Cytosol | Nucleus | ||||||
| Expt B |
1 peptide |
3 spectra |
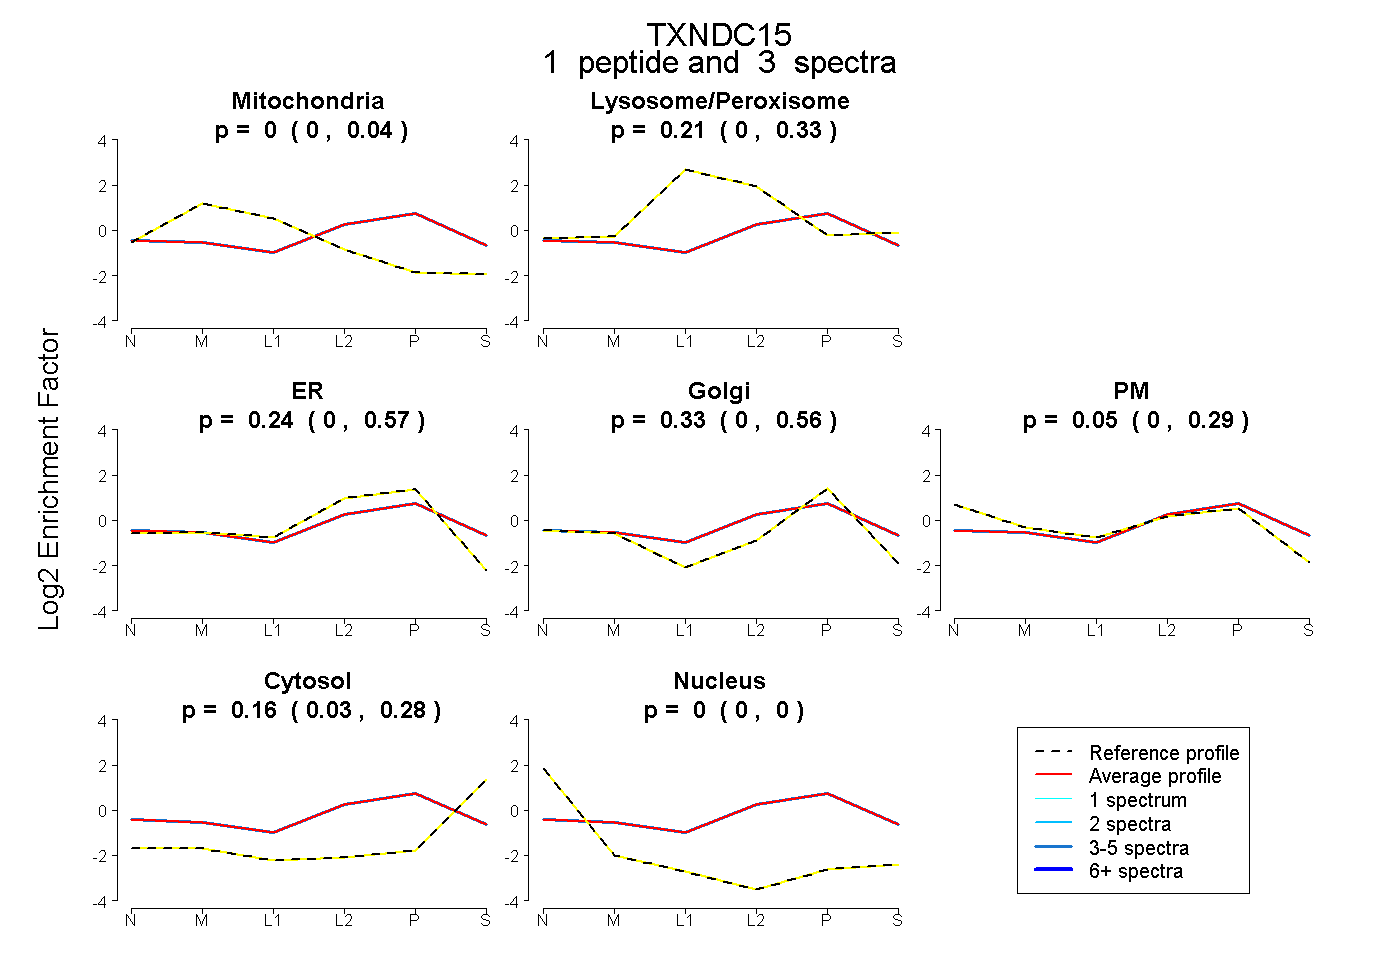 |
0.000 0.000 | 0.035 |
0.207 0.000 | 0.332 |
0.245 0.000 | 0.568 |
0.332 0.000 | 0.559 |
0.053 0.000 | 0.294 |
0.163 0.026 | 0.282 |
0.000 0.000 | 0.000 |
|||
| Plot | Lyso | Other | |||||||||||
| Expt C |
3 peptides |
8 spectra |
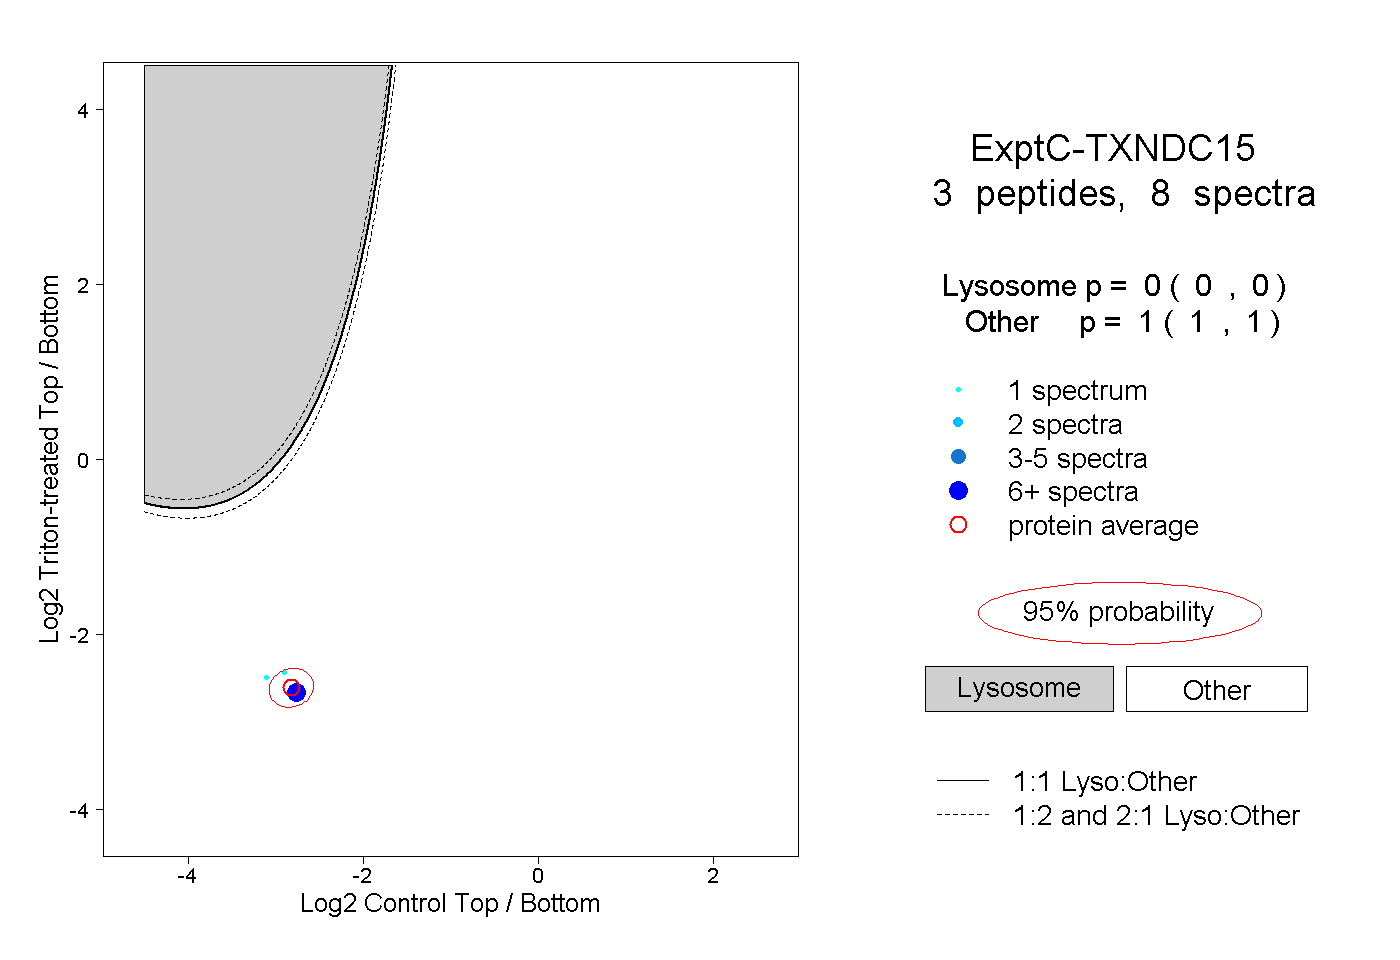 |
0.000 0.000 | 0.000 |
1.000 1.000 | 1.000 |
||||||||
| Plot | Lyso | Other | |||||||||||
| Expt D |
2 peptides |
4 spectra |
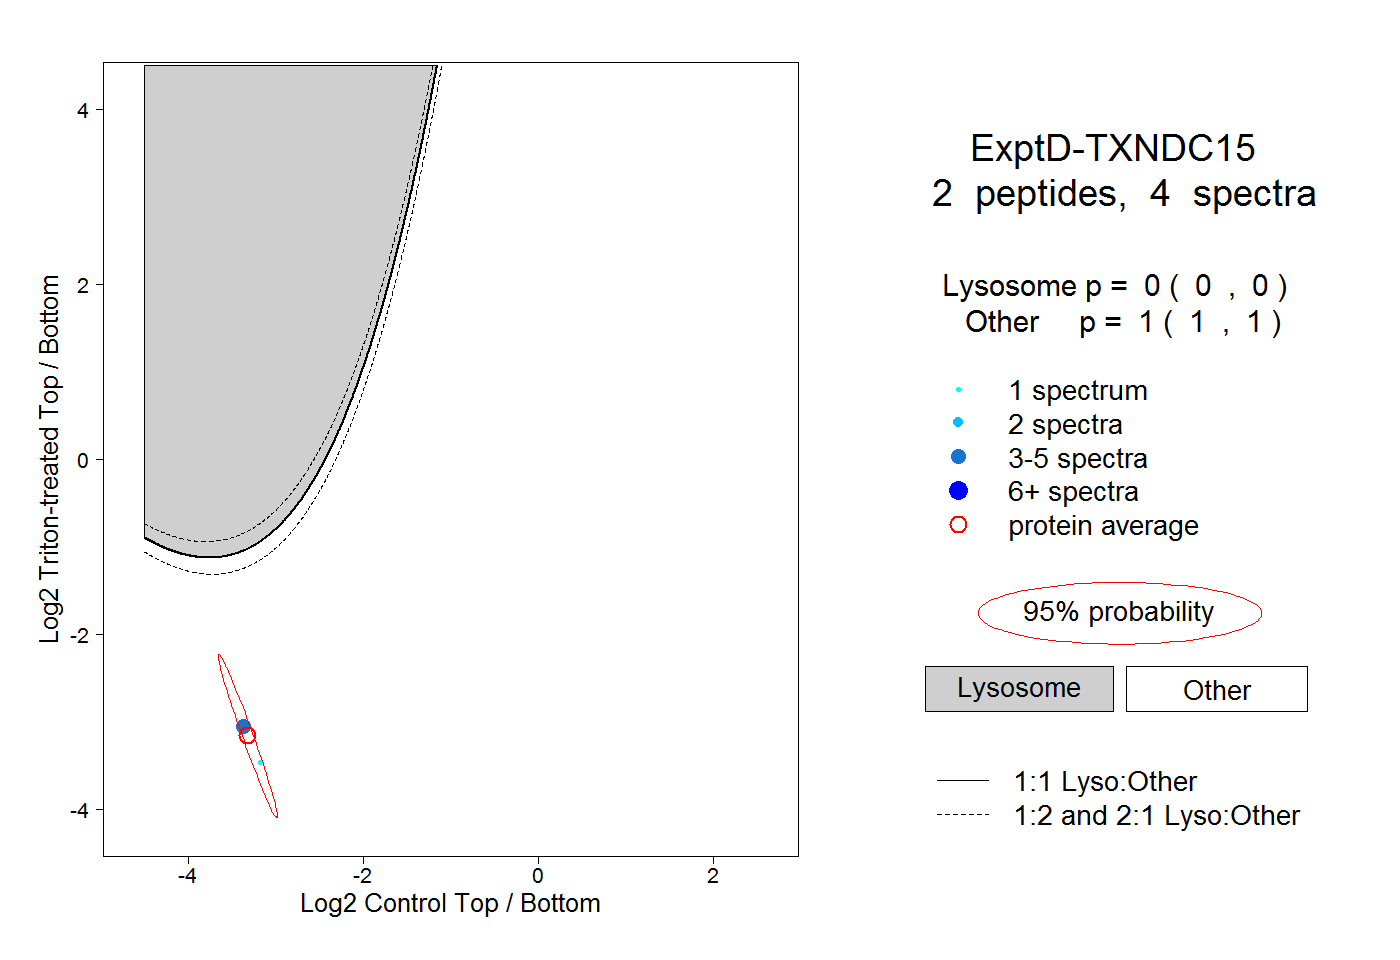 |
0.000 0.000 | 0.000 |
1.000 1.000 | 1.000 |