 10
10peptides
spectra
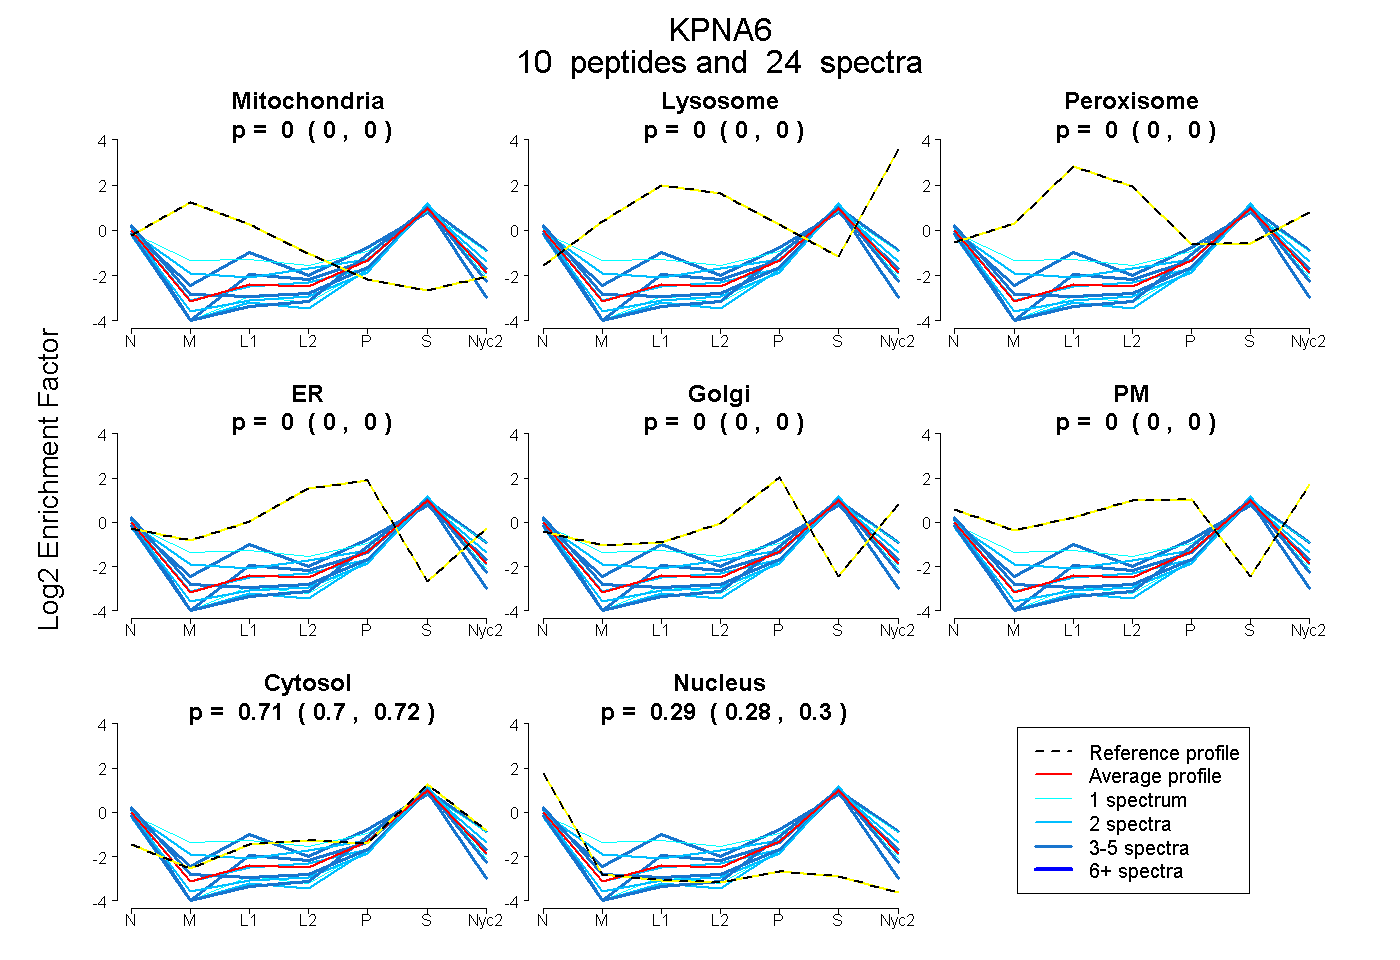
0.000 | 0.000
0.000 | 0.000
0.000 | 0.000
0.000 | 0.000
0.000 | 0.000
0.000 | 0.000
0.702 | 0.718
0.280 | 0.297
| Plot | Mito | Lyso | Perox | ER | Golgi | PM | Cytosol | Nucleus | |||||
| Expt A |
10 peptides |
24 spectra |
|
0.000 0.000 | 0.000 |
0.000 0.000 | 0.000 |
0.000 0.000 | 0.000 |
0.000 0.000 | 0.000 |
0.000 0.000 | 0.000 |
0.000 0.000 | 0.000 |
0.711 0.702 | 0.718 |
0.289 0.280 | 0.297 |
| 2 spectra, VASPALR | 0.000 | 0.000 | 0.000 | 0.000 | 0.000 | 0.000 | 0.660 | 0.340 | ||
| 1 spectrum, EQQLFK | 0.104 | 0.000 | 0.000 | 0.000 | 0.000 | 0.107 | 0.719 | 0.070 | ||
| 5 spectra, EACWTISNITAGNR | 0.000 | 0.000 | 0.051 | 0.000 | 0.030 | 0.000 | 0.715 | 0.204 | ||
| 2 spectra, FVEFLK | 0.000 | 0.000 | 0.000 | 0.000 | 0.000 | 0.000 | 0.656 | 0.344 | ||
| 1 spectrum, EAAWAITNATSGGTPEQIR | 0.000 | 0.000 | 0.000 | 0.000 | 0.000 | 0.000 | 0.641 | 0.359 | ||
| 3 spectra, VSPCLPVLSR | 0.000 | 0.000 | 0.000 | 0.000 | 0.000 | 0.000 | 0.634 | 0.366 | ||
| 2 spectra, IQAVIDSGVCR | 0.000 | 0.000 | 0.000 | 0.000 | 0.000 | 0.000 | 0.685 | 0.315 | ||
| 3 spectra, NAVWALSNLCR | 0.000 | 0.000 | 0.000 | 0.000 | 0.000 | 0.000 | 0.577 | 0.423 | ||
| 3 spectra, EEQLFK | 0.000 | 0.000 | 0.000 | 0.000 | 0.000 | 0.000 | 0.788 | 0.212 | ||
| 2 spectra, LVELLMHNDYK | 0.000 | 0.000 | 0.000 | 0.000 | 0.000 | 0.036 | 0.763 | 0.201 |
| Plot | Mito | Lyso or Perox | ER | Golgi | PM | Cytosol | Nucleus | ||||||
| Expt B |
2 peptides |
2 spectra |
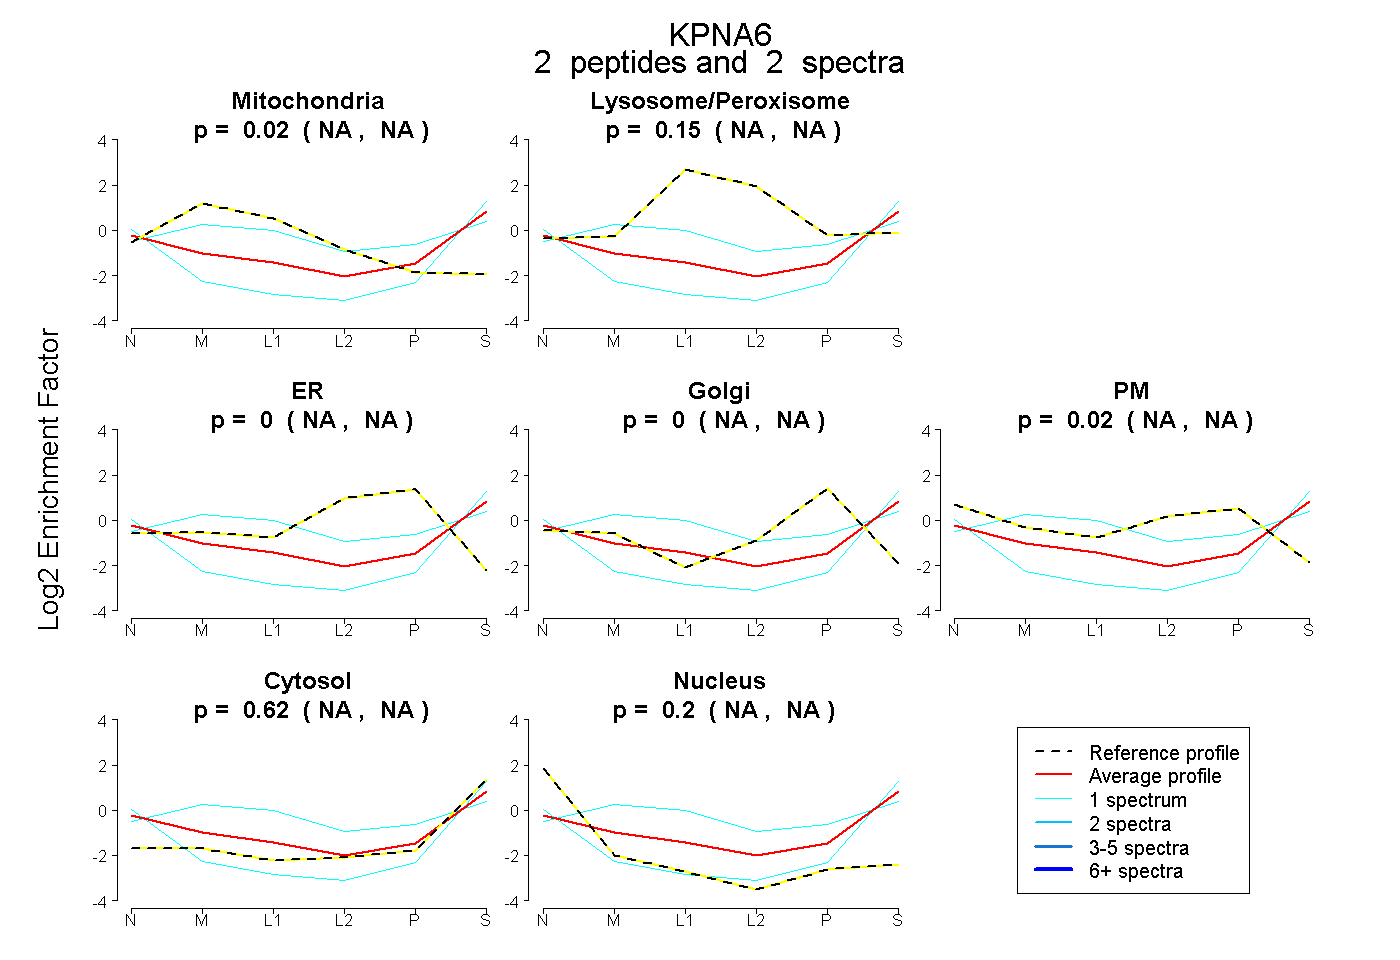 |
0.017 NA | NA |
0.151 NA | NA |
0.000 NA | NA |
0.000 NA | NA |
0.018 NA | NA |
0.617 NA | NA |
0.198 NA | NA |
|||
| Plot | Lyso | Other | |||||||||||
| Expt C |
1 peptide |
2 spectra |
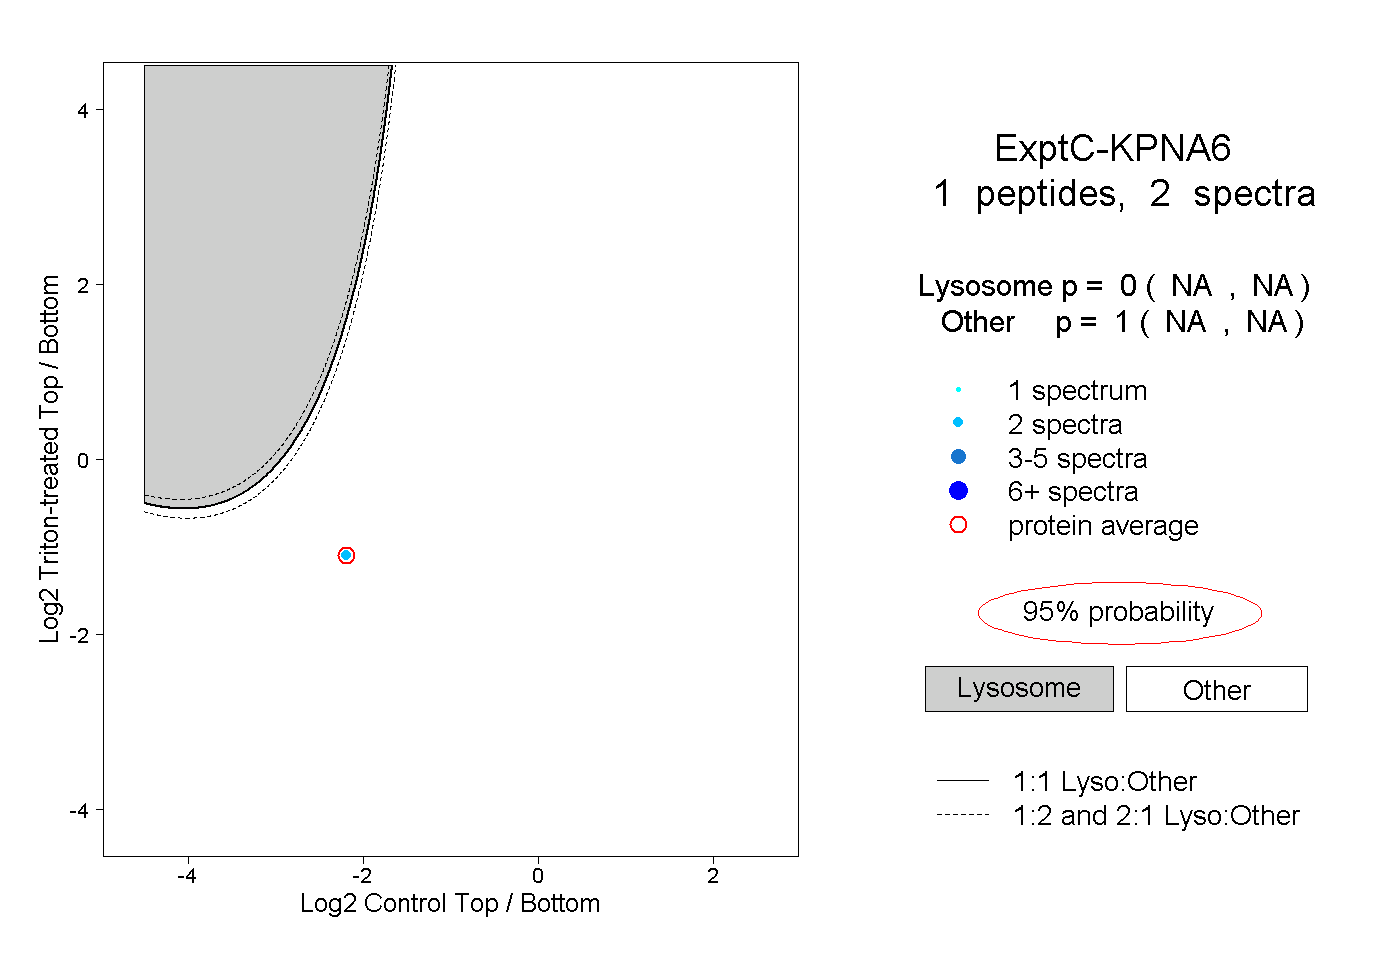 |
0.000 NA | NA |
1.000 NA | NA |