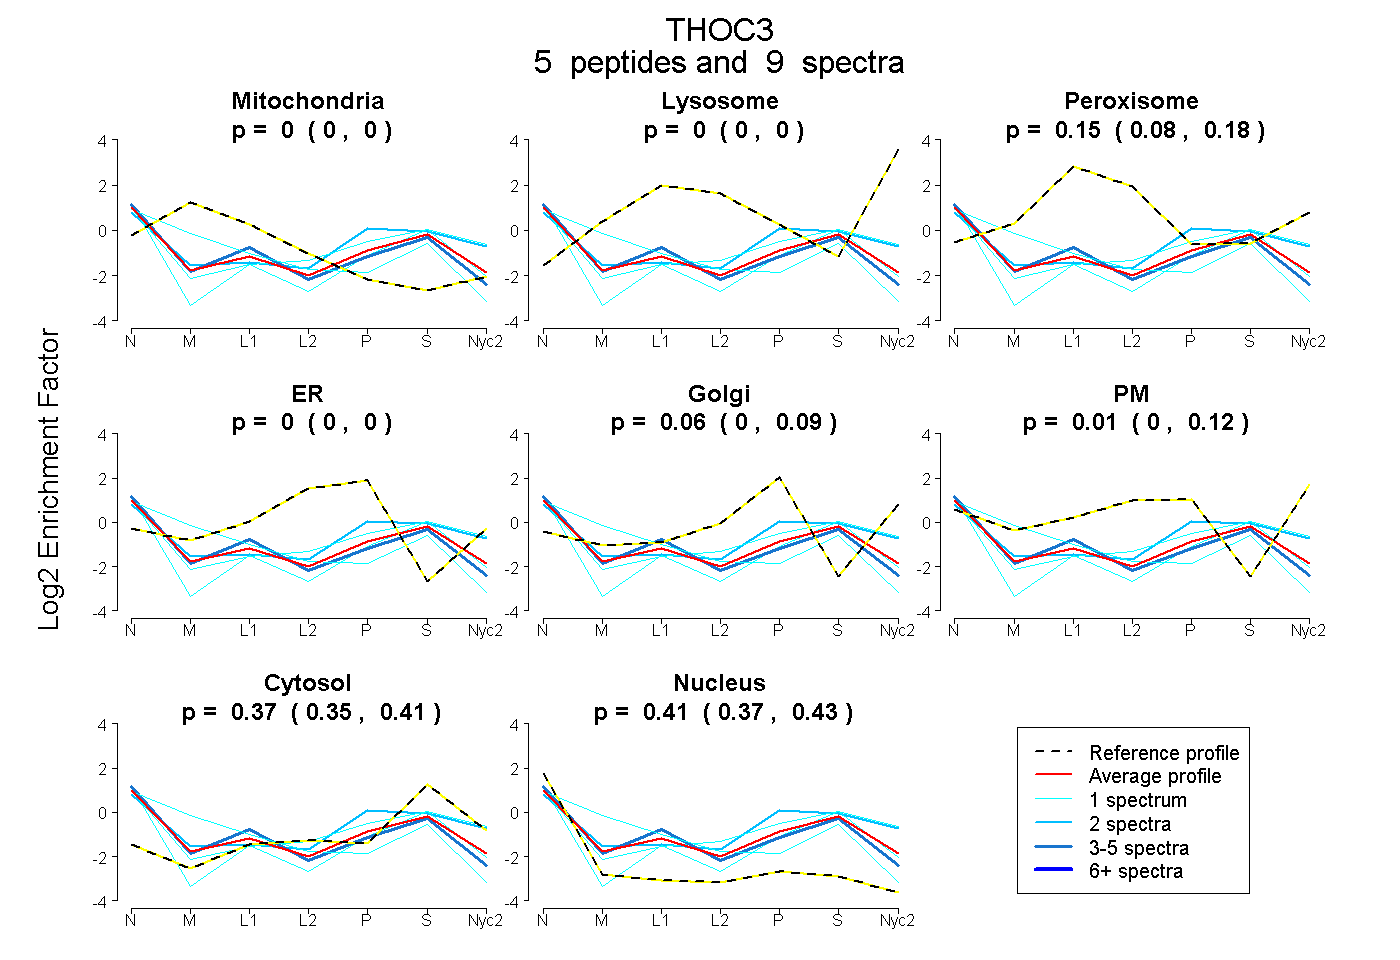
 5
5peptides
spectra
0.000 | 0.000
0.000 | 0.000
0.076 | 0.178
0.000 | 0.000
0.000 | 0.094
0.000 | 0.119
0.346 | 0.412
0.369 | 0.434
| Plot | Mito | Lyso | Perox | ER | Golgi | PM | Cytosol | Nucleus | |||||
| Expt A |
5 peptides |
9 spectra |
|
0.000 0.000 | 0.000 |
0.000 0.000 | 0.000 |
0.150 0.076 | 0.178 |
0.000 0.000 | 0.000 |
0.063 0.000 | 0.094 |
0.007 0.000 | 0.119 |
0.372 0.346 | 0.412 |
0.409 0.369 | 0.434 |
| 4 spectra, LDWPVR | 0.000 | 0.000 | 0.208 | 0.000 | 0.000 | 0.000 | 0.305 | 0.486 | ||
| 1 spectrum, FDPMGK | 0.000 | 0.000 | 0.000 | 0.000 | 0.009 | 0.007 | 0.537 | 0.447 | ||
| 1 spectrum, EAGTVK | 0.000 | 0.000 | 0.000 | 0.000 | 0.000 | 0.274 | 0.495 | 0.232 | ||
| 2 spectra, DDVVTFIDAK | 0.000 | 0.000 | 0.000 | 0.000 | 0.199 | 0.153 | 0.439 | 0.209 | ||
| 1 spectrum, YVLGMQELFR | 0.476 | 0.000 | 0.000 | 0.000 | 0.000 | 0.000 | 0.240 | 0.283 |
| Plot | Lyso | Other | |||||||||||
| Expt C |
1 peptide |
7 spectra |
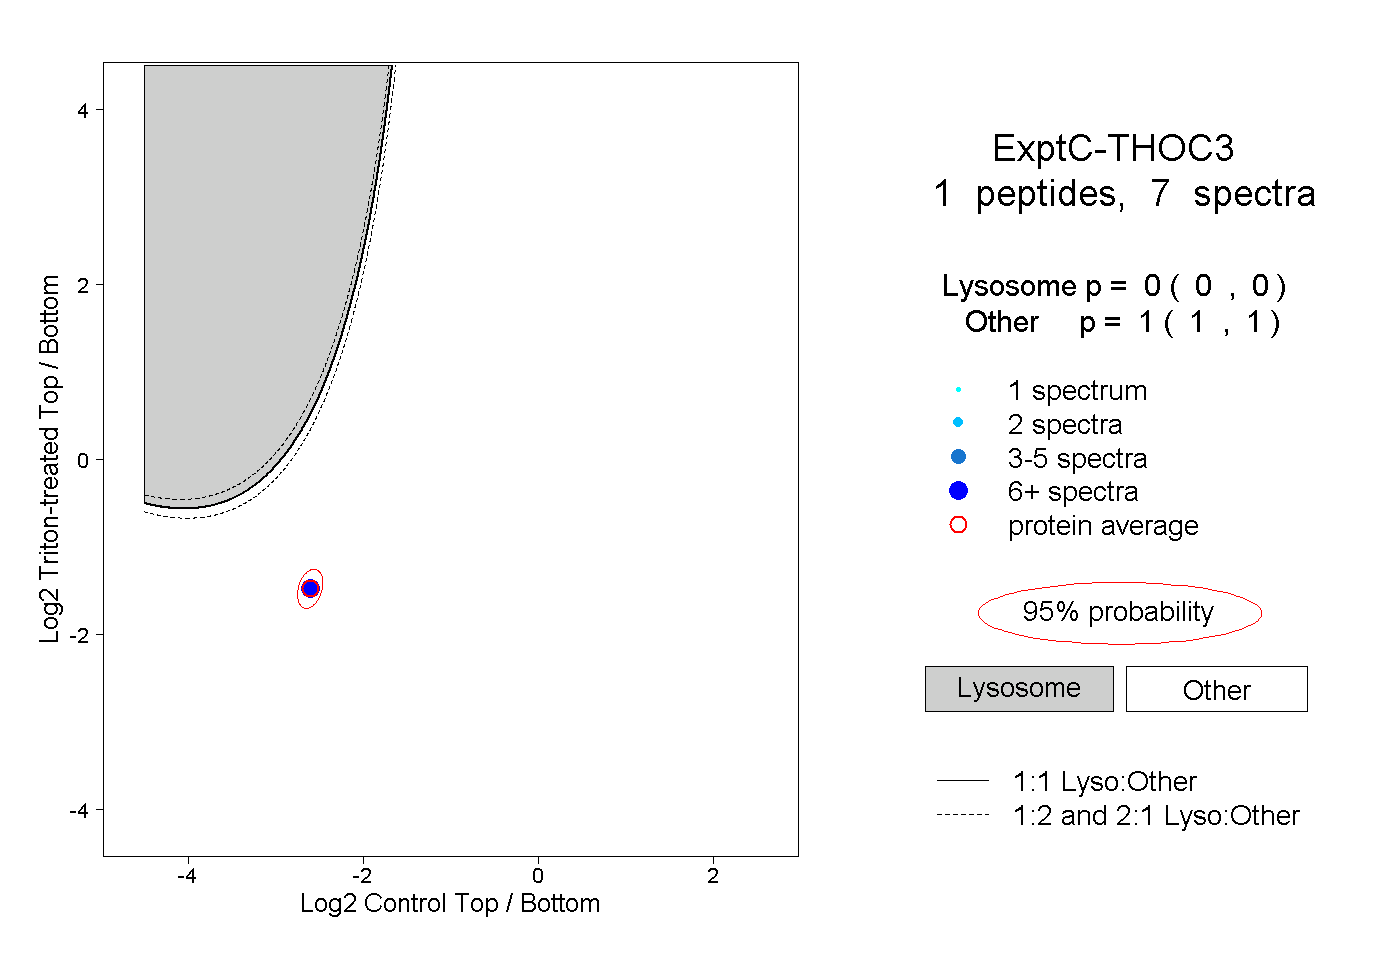 |
0.000 0.000 | 0.000 |
1.000 1.000 | 1.000 |