25
25peptides
spectra
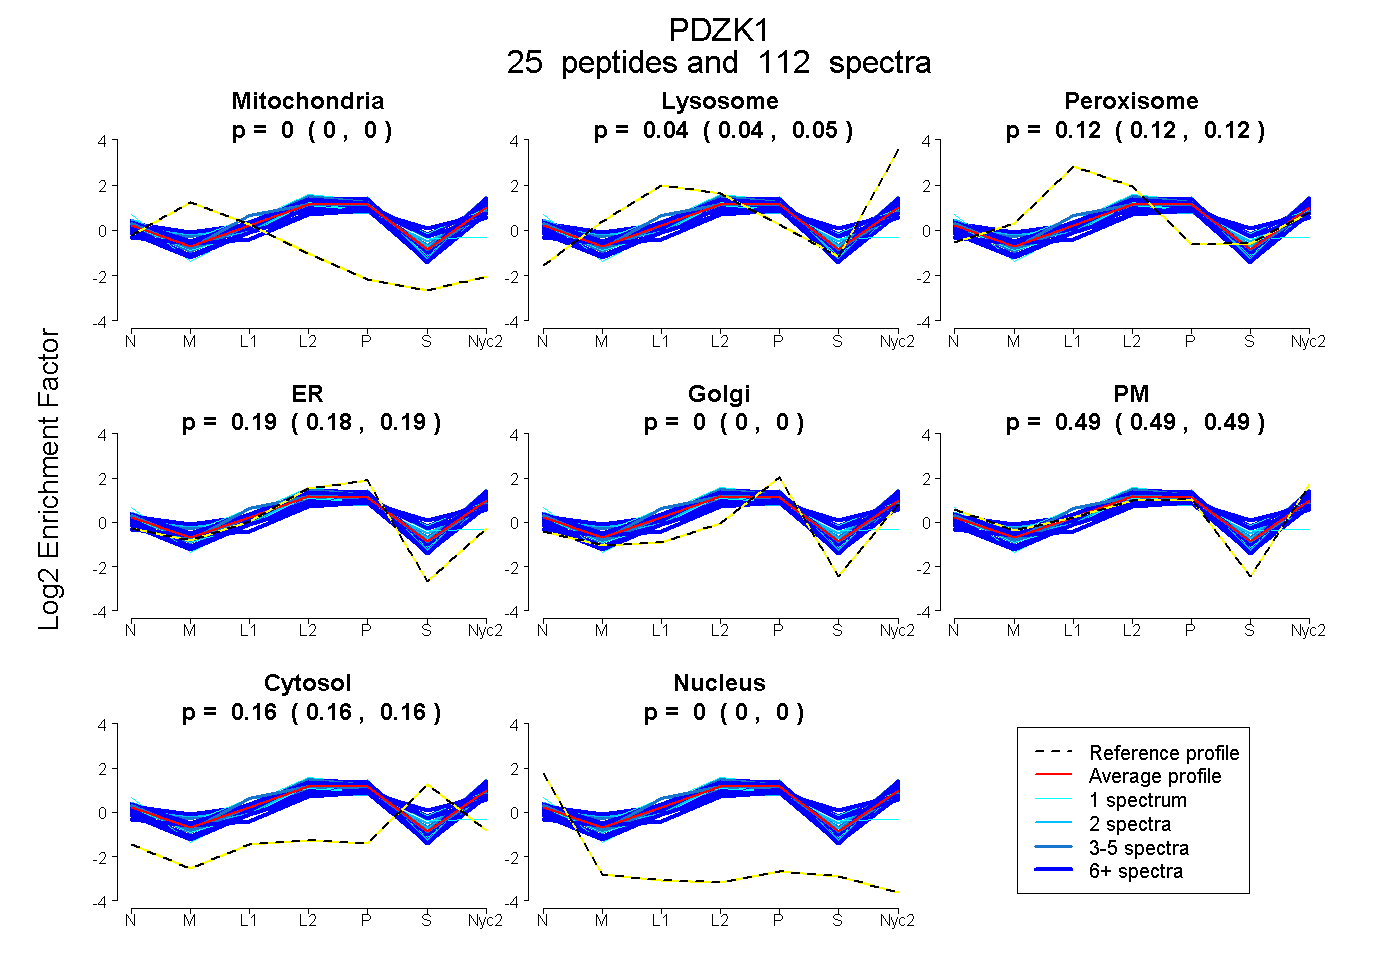
0.000 | 0.000
0.041 | 0.048
0.116 | 0.122
0.182 | 0.189
0.000 | 0.000
0.485 | 0.495
0.158 | 0.161
0.000 | 0.000
13peptides
spectra
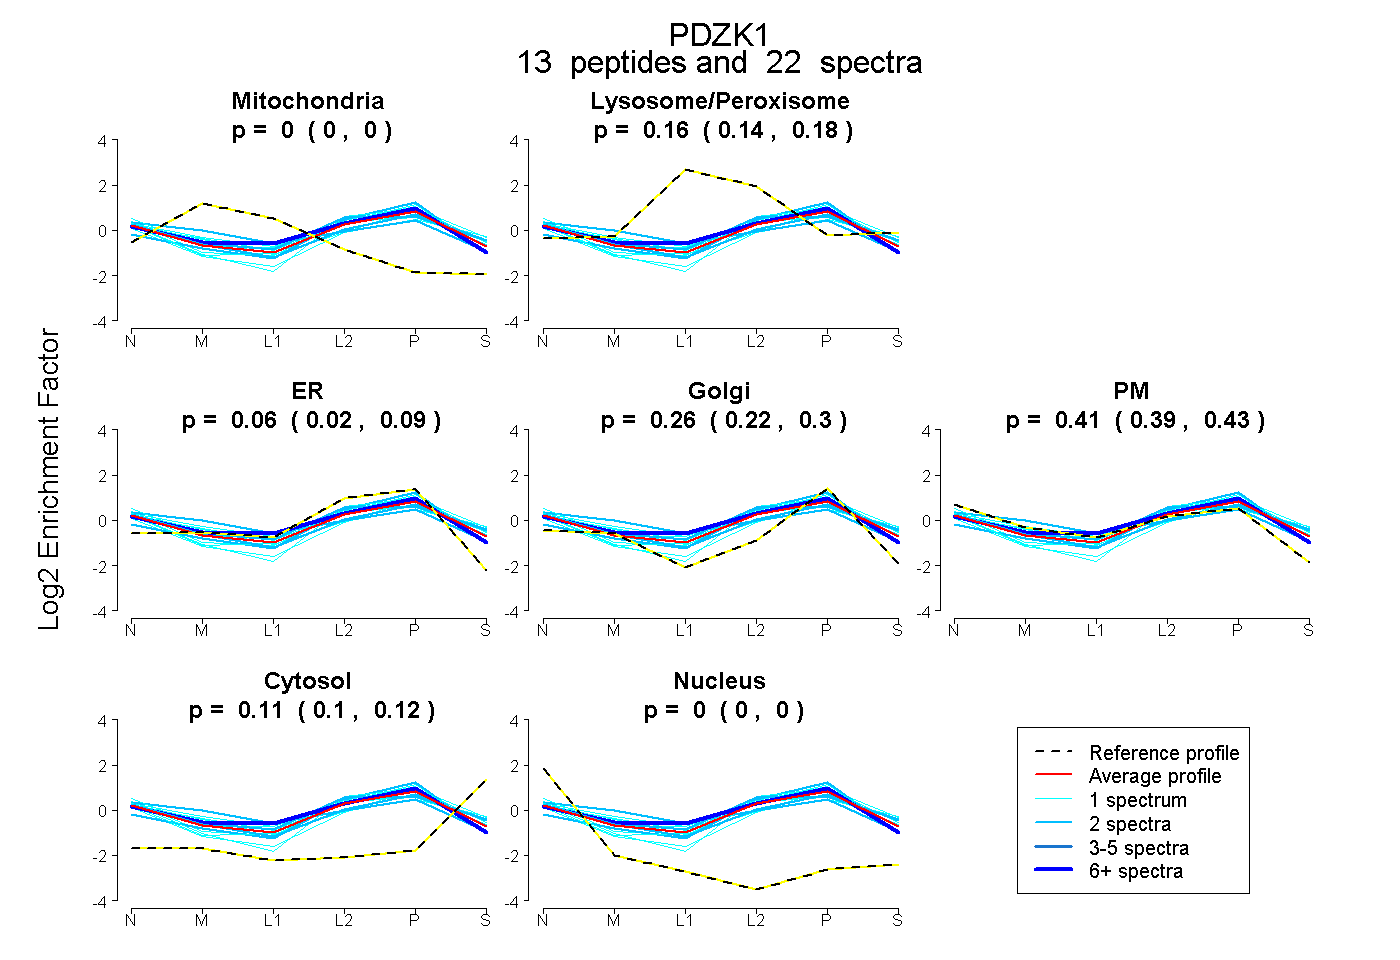
0.000 | 0.000
0.141 | 0.178
0.021 | 0.087
0.223 | 0.297
0.390 | 0.432
0.095 | 0.117
0.000 | 0.000