 18
18peptides
spectra
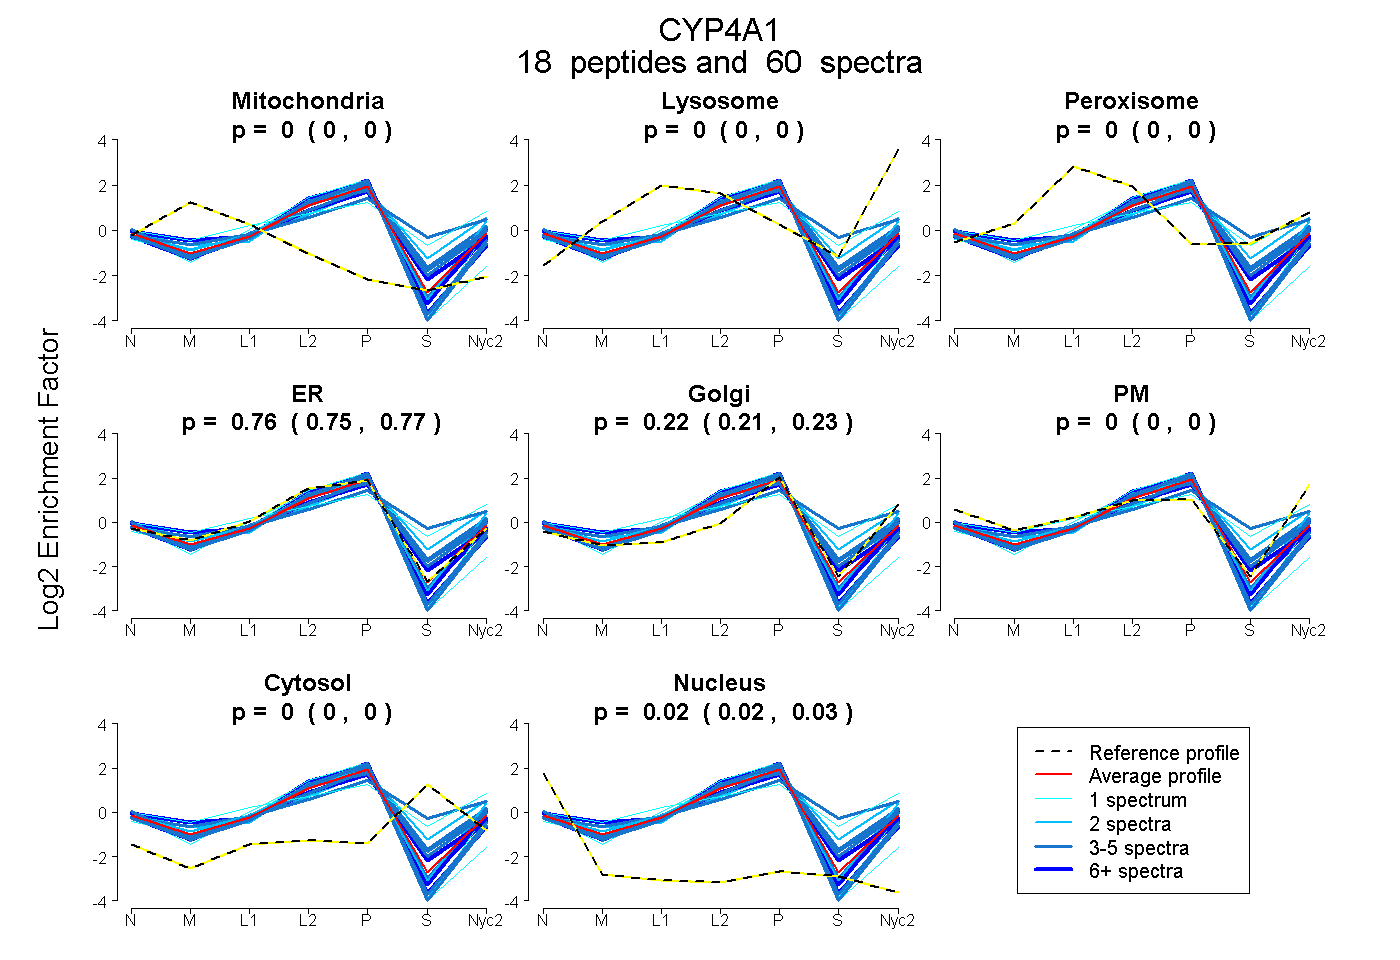
0.000 | 0.000
0.000 | 0.000
0.000 | 0.000
0.750 | 0.767
0.206 | 0.226
0.000 | 0.000
0.000 | 0.000
0.021 | 0.026
6peptides
spectra
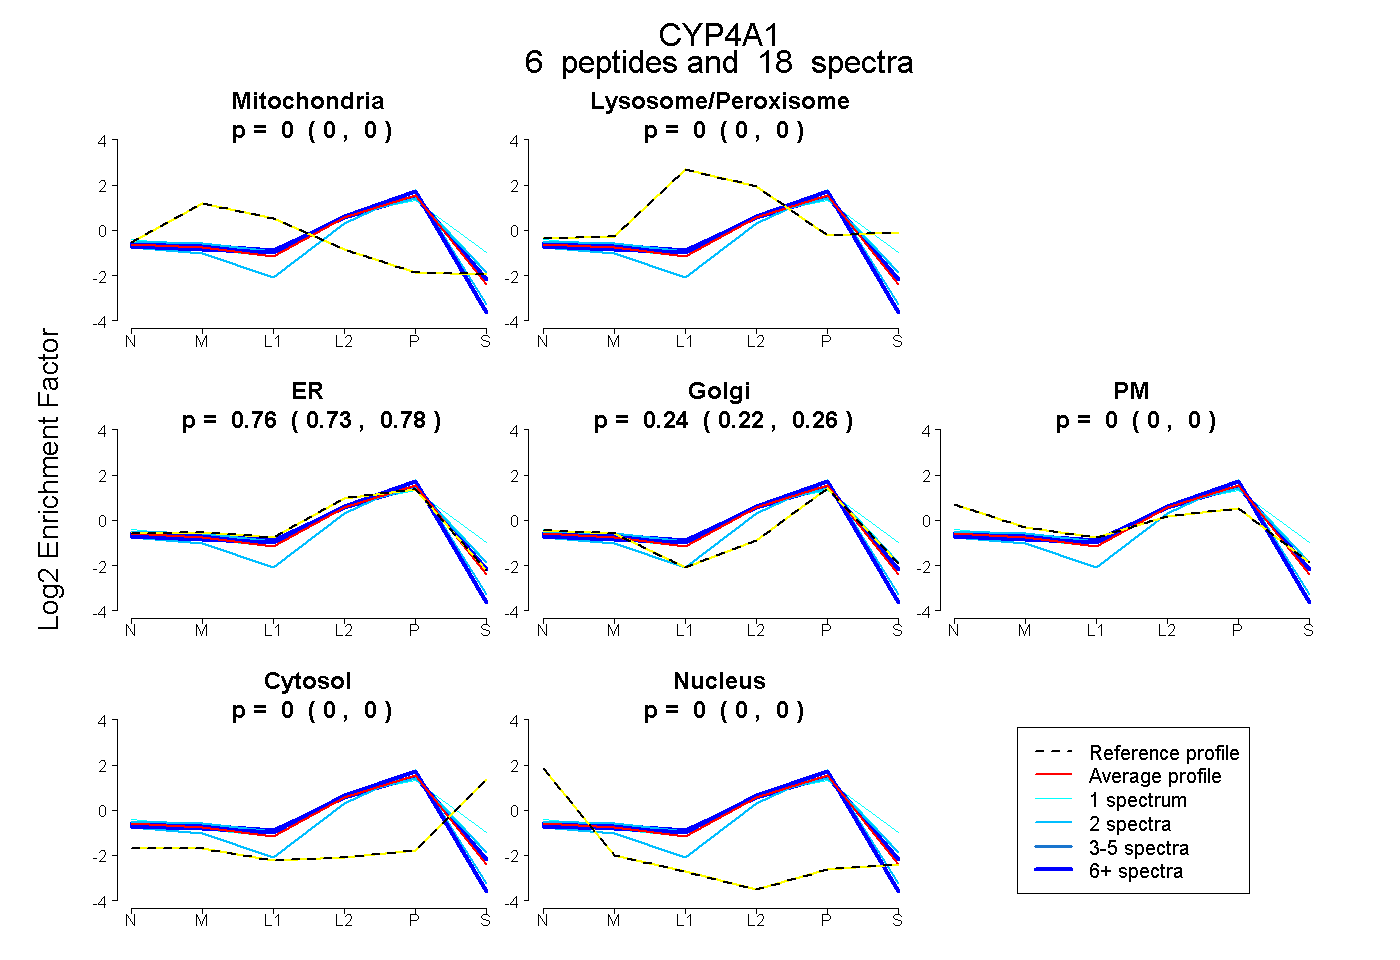
0.000 | 0.000
0.000 | 0.000
0.733 | 0.781
0.216 | 0.261
0.000 | 0.000
0.000 | 0.000
0.000 | 0.000
17peptides
spectra
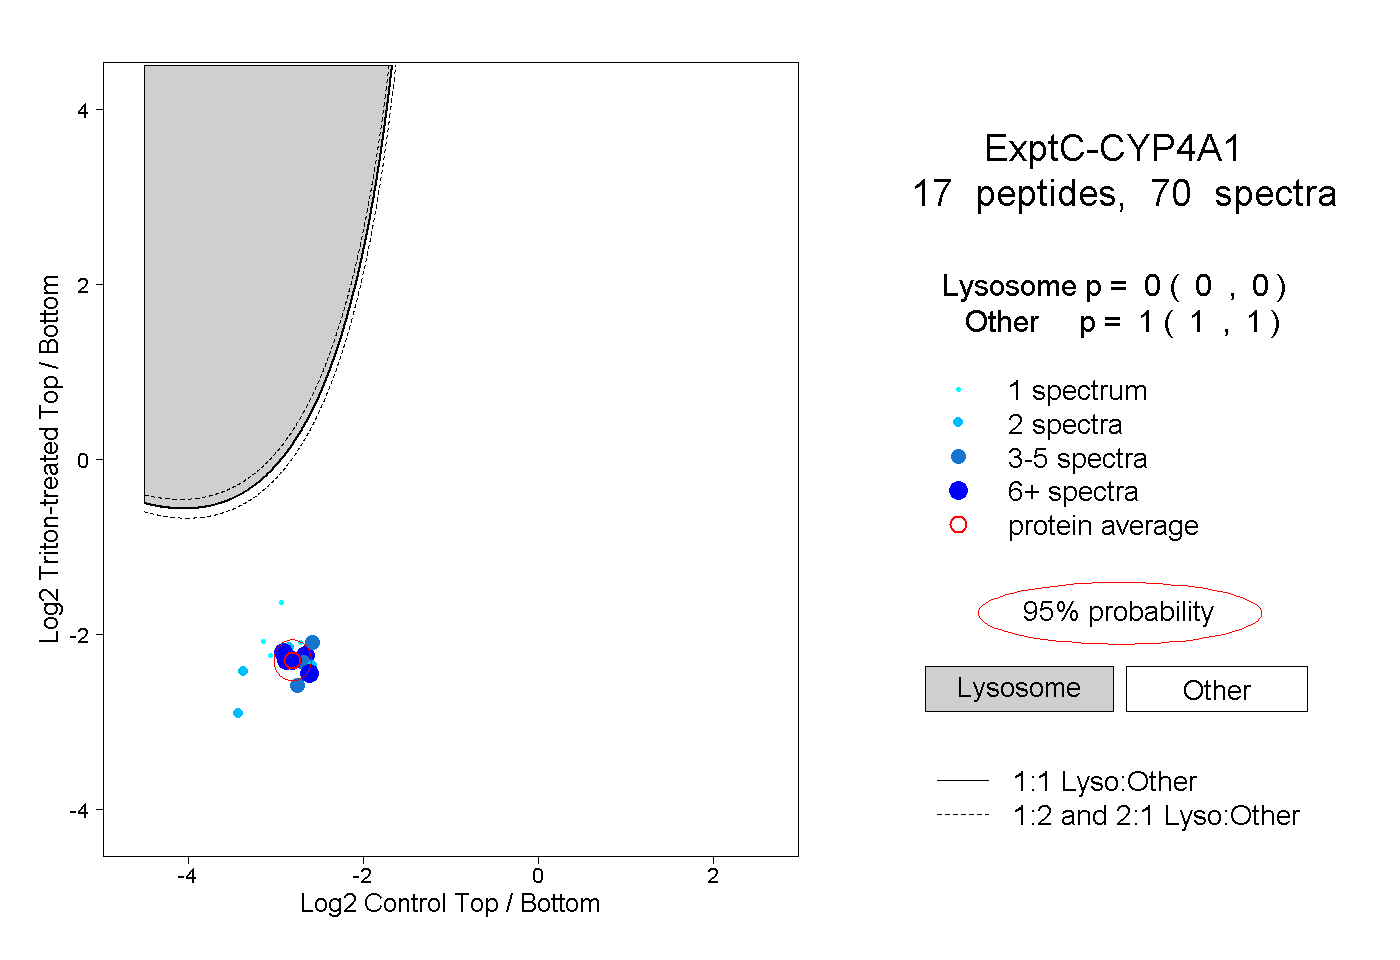
0.000 | 0.000
1.000 | 1.000
3peptides
spectra
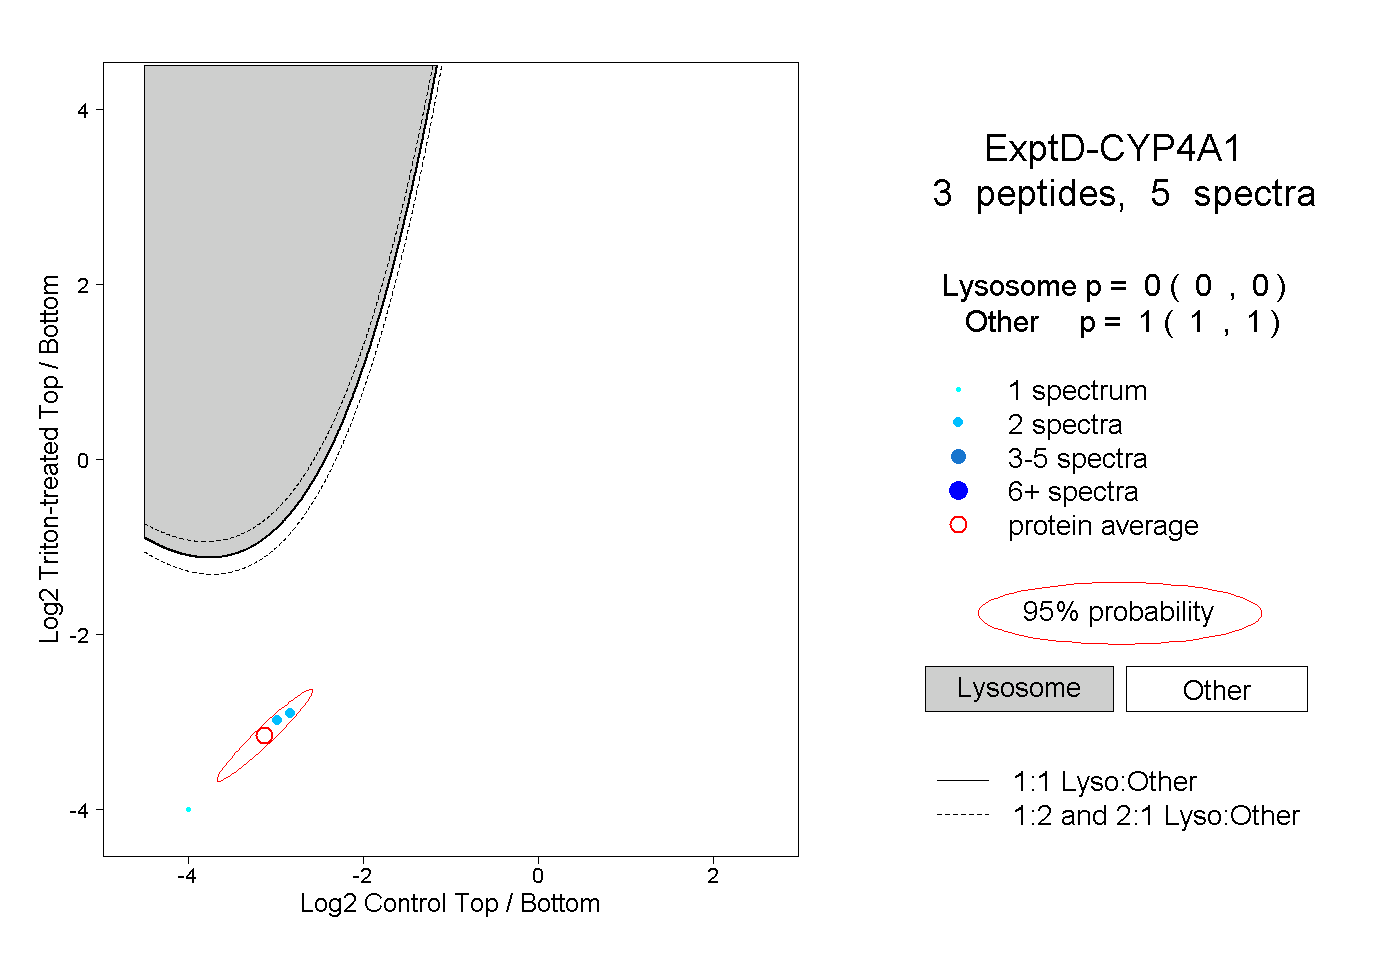
0.000 | 0.000
1.000 | 1.000