 4
4peptides
spectra
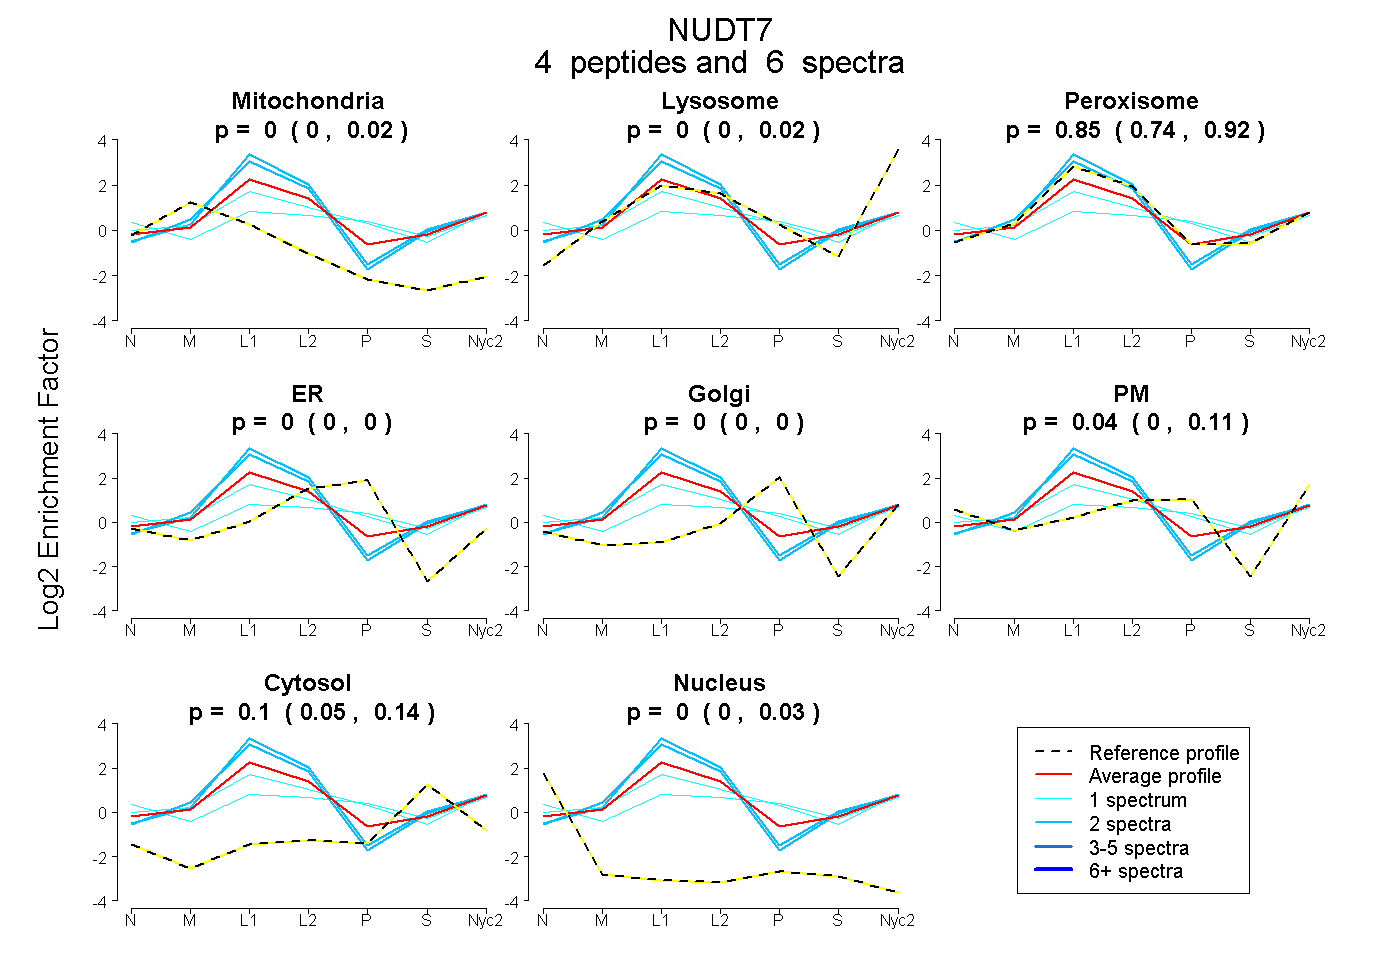
0.000 | 0.021
0.000 | 0.020
0.738 | 0.921
0.000 | 0.000
0.000 | 0.000
0.000 | 0.114
0.053 | 0.137
0.000 | 0.030
2peptides
spectra
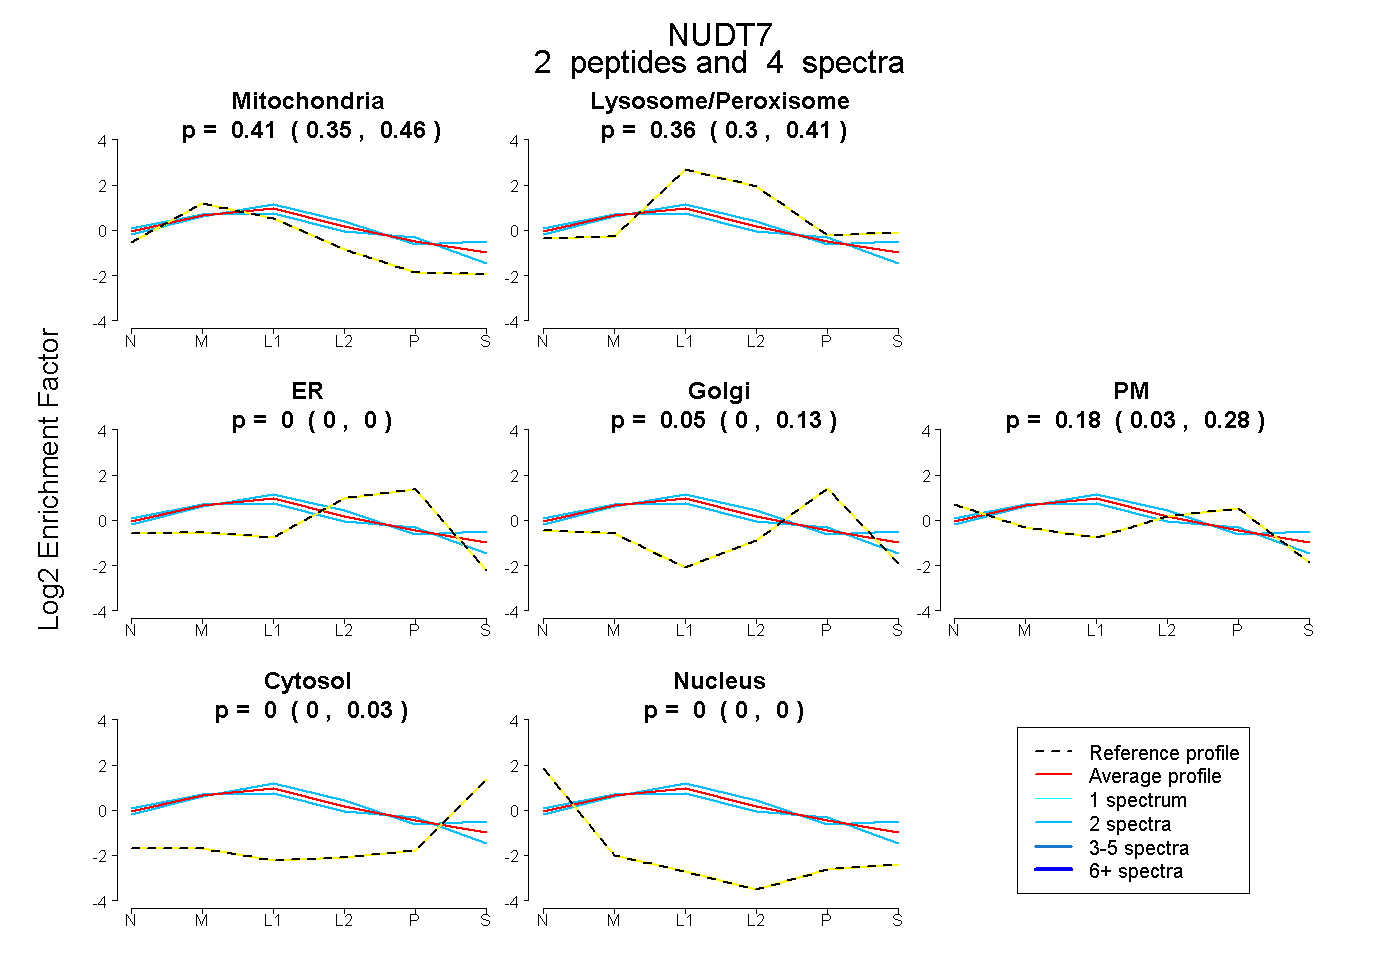
0.346 | 0.457
0.300 | 0.406
0.000 | 0.000
0.000 | 0.128
0.026 | 0.277
0.000 | 0.033
0.000 | 0.000
8peptides
spectra
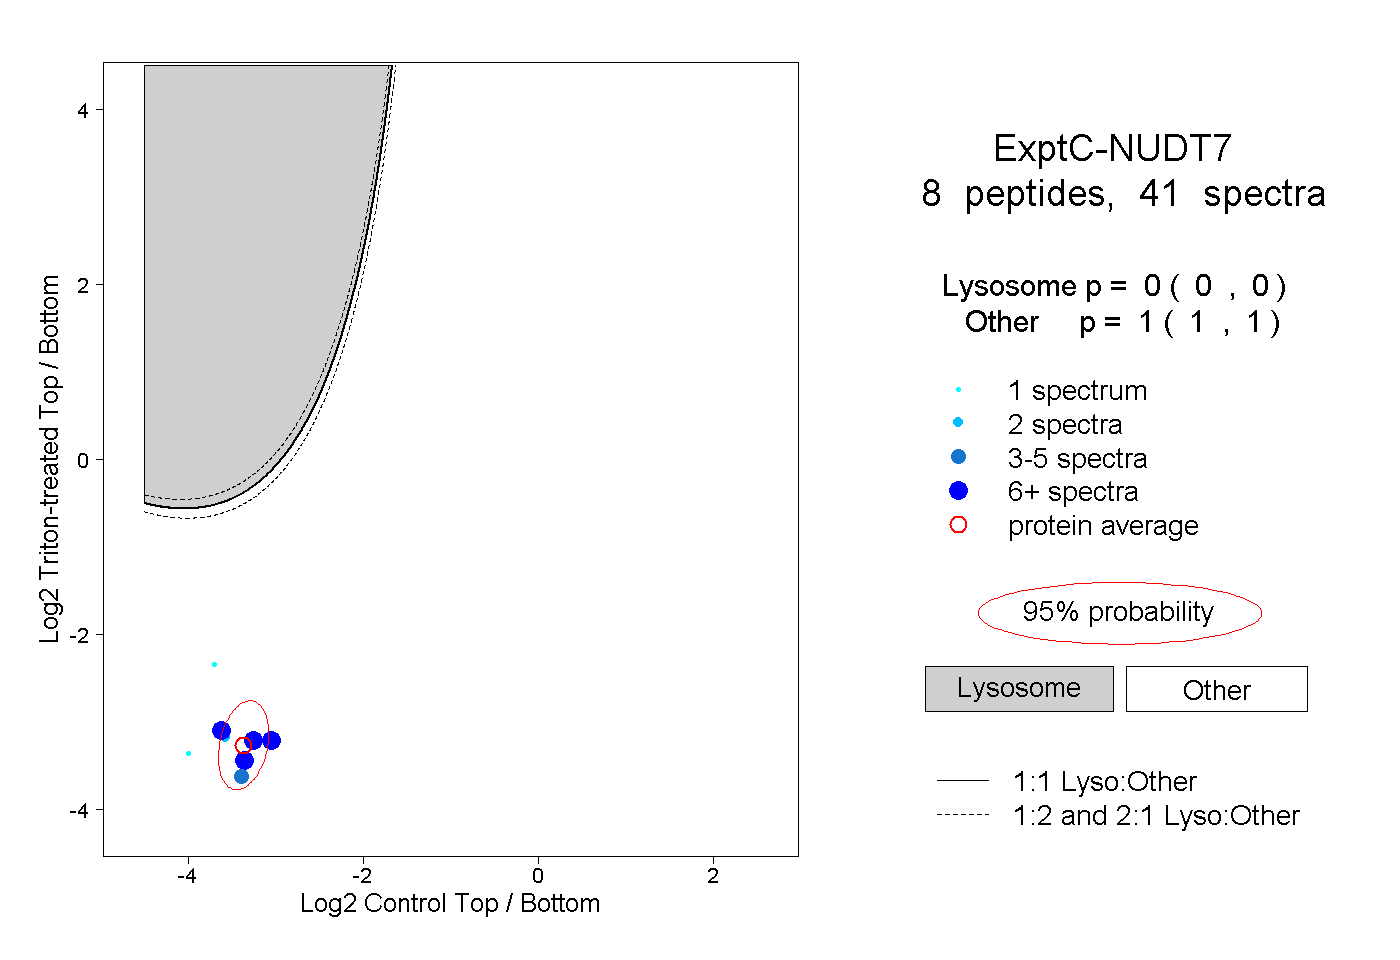
0.000 | 0.000
1.000 | 1.000
3peptides
spectra
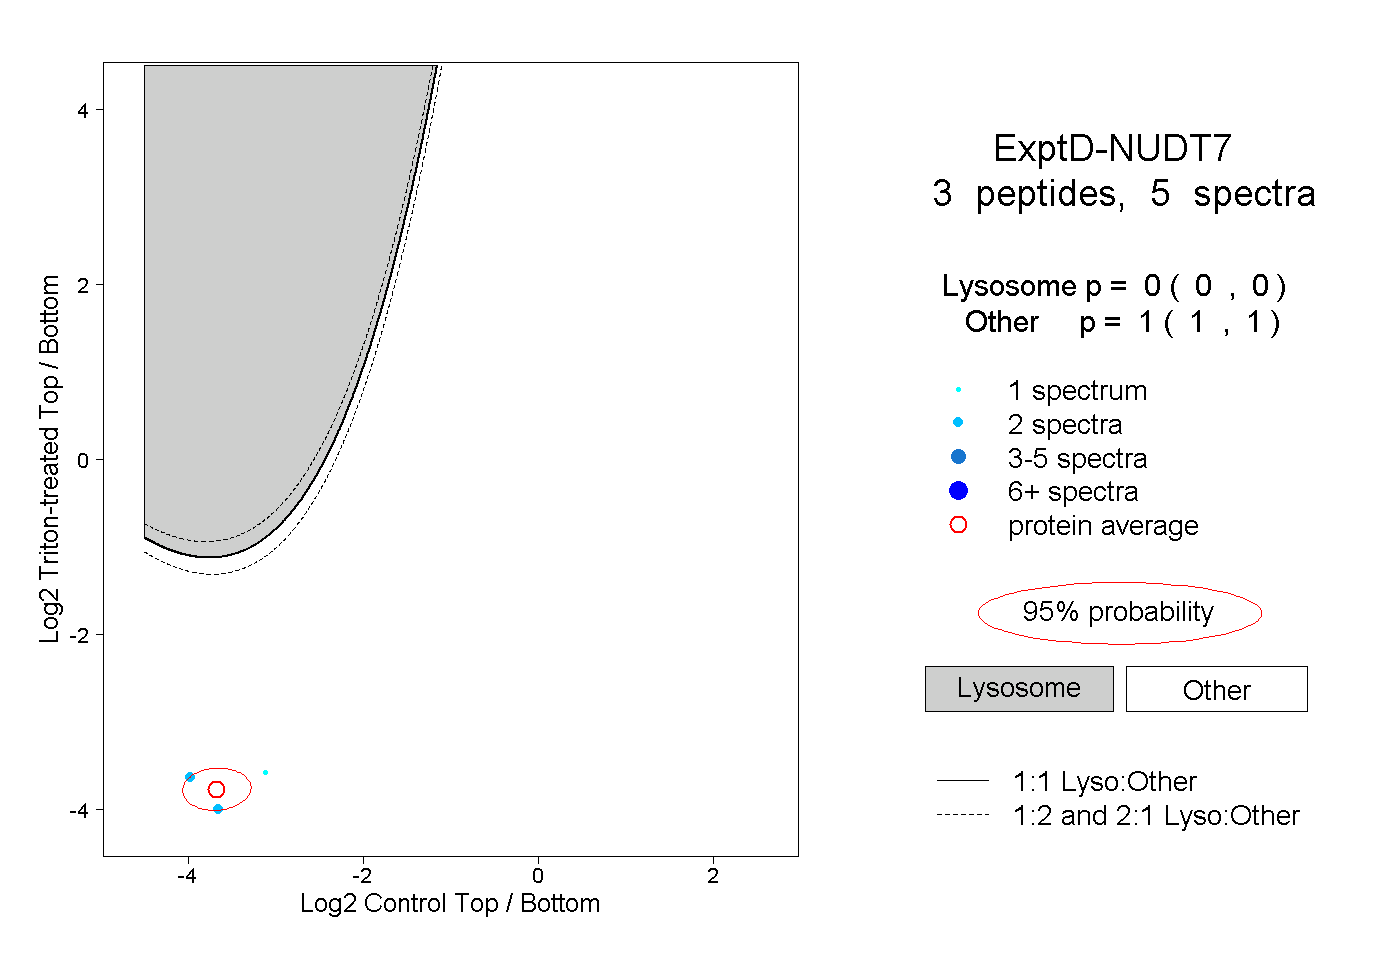
0.000 | 0.000
1.000 | 1.000