 3
3peptides
spectra
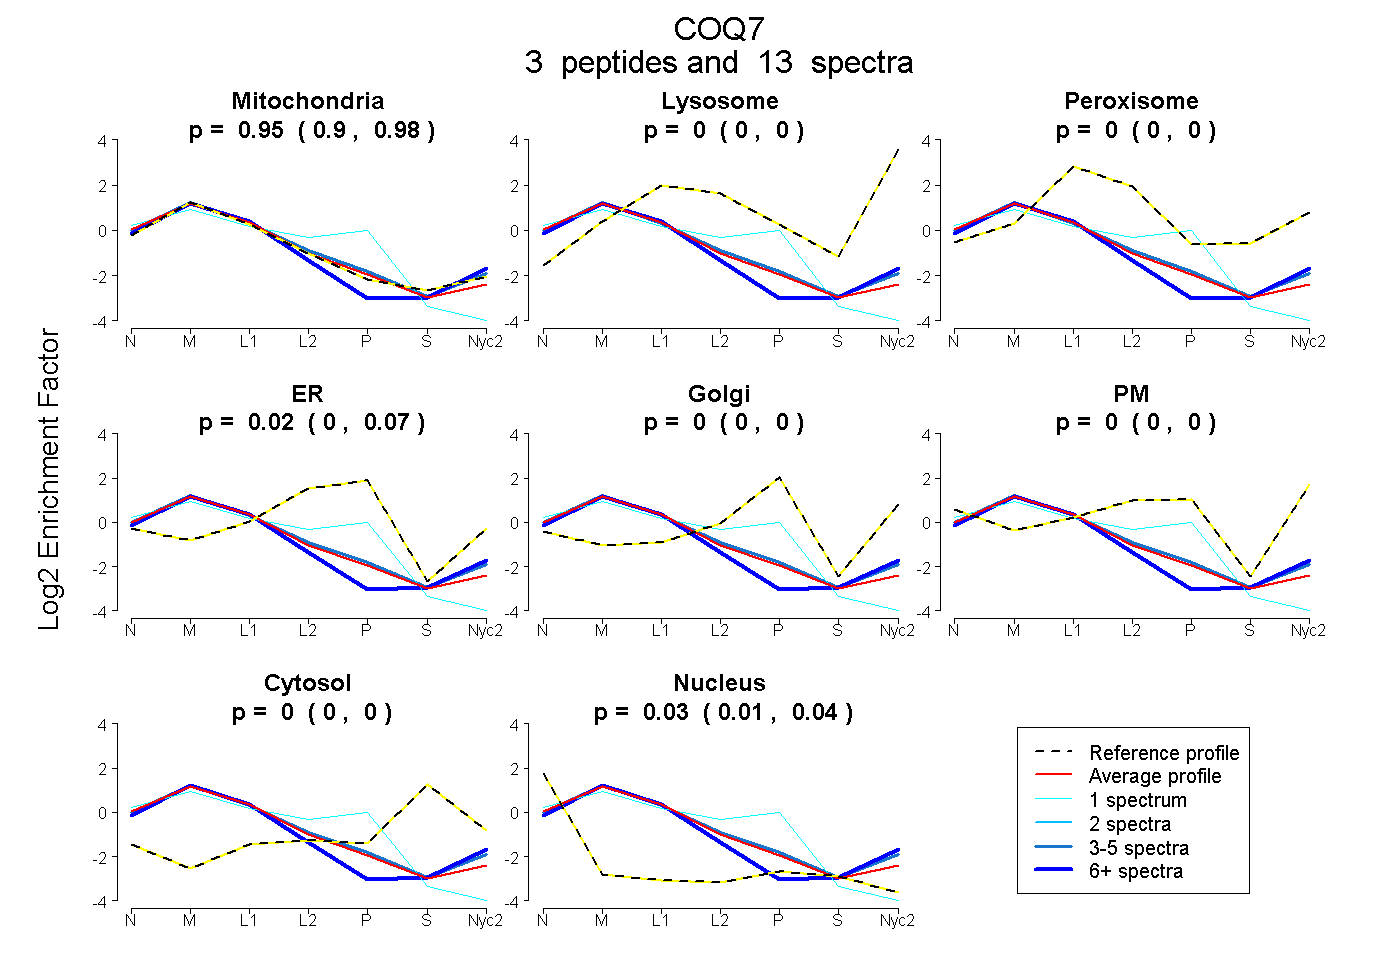
0.897 | 0.976
0.000 | 0.000
0.000 | 0.000
0.000 | 0.067
0.000 | 0.000
0.000 | 0.000
0.000 | 0.000
0.010 | 0.045
2peptides
spectra
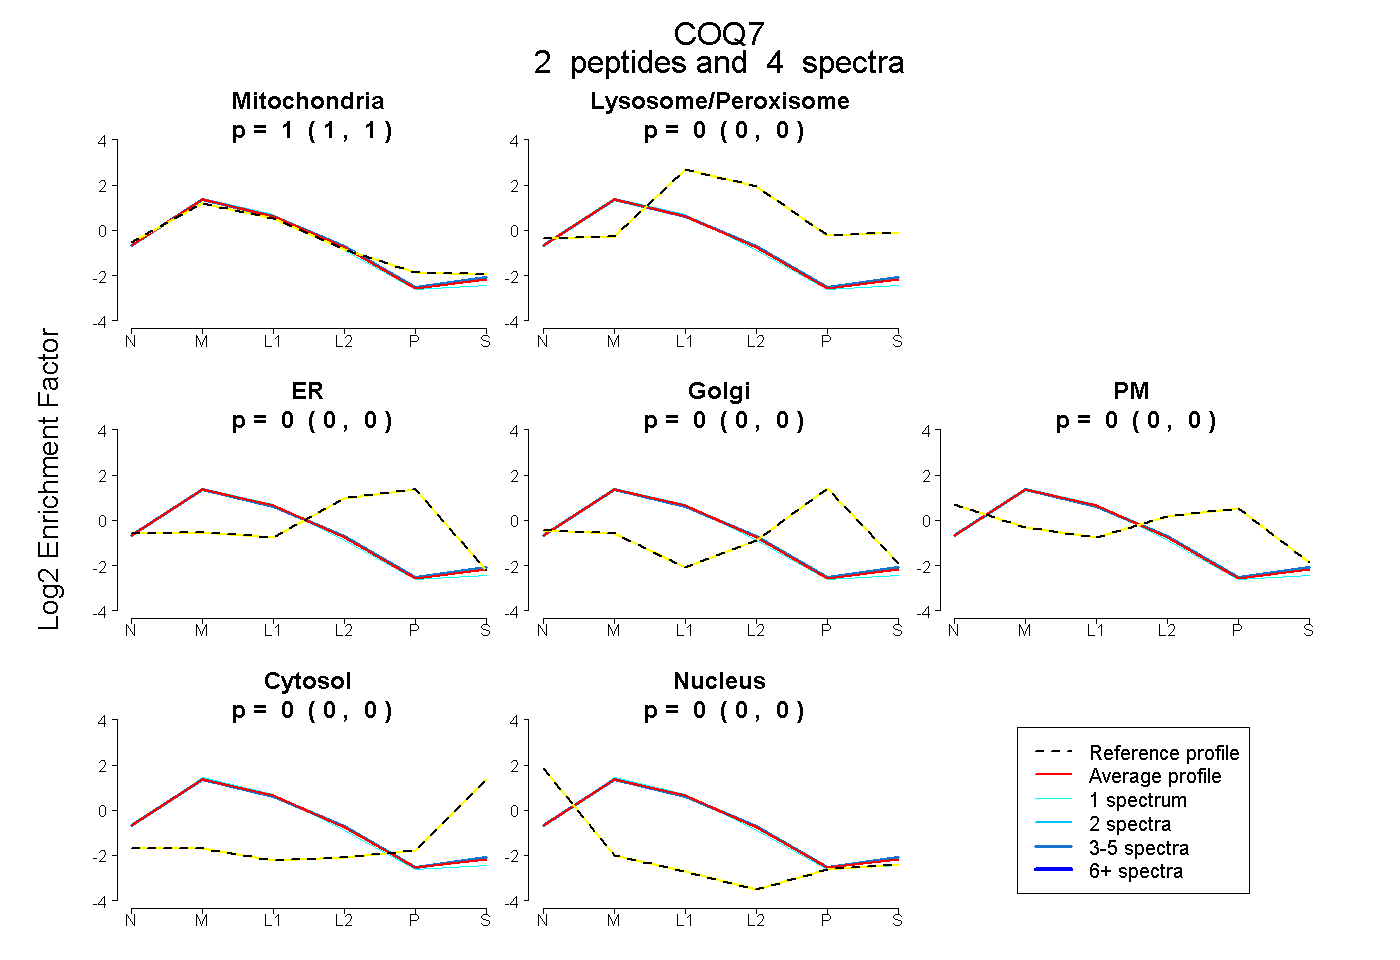
1.000 | 1.000
0.000 | 0.000
0.000 | 0.000
0.000 | 0.000
0.000 | 0.000
0.000 | 0.000
0.000 | 0.000
6peptides
spectra
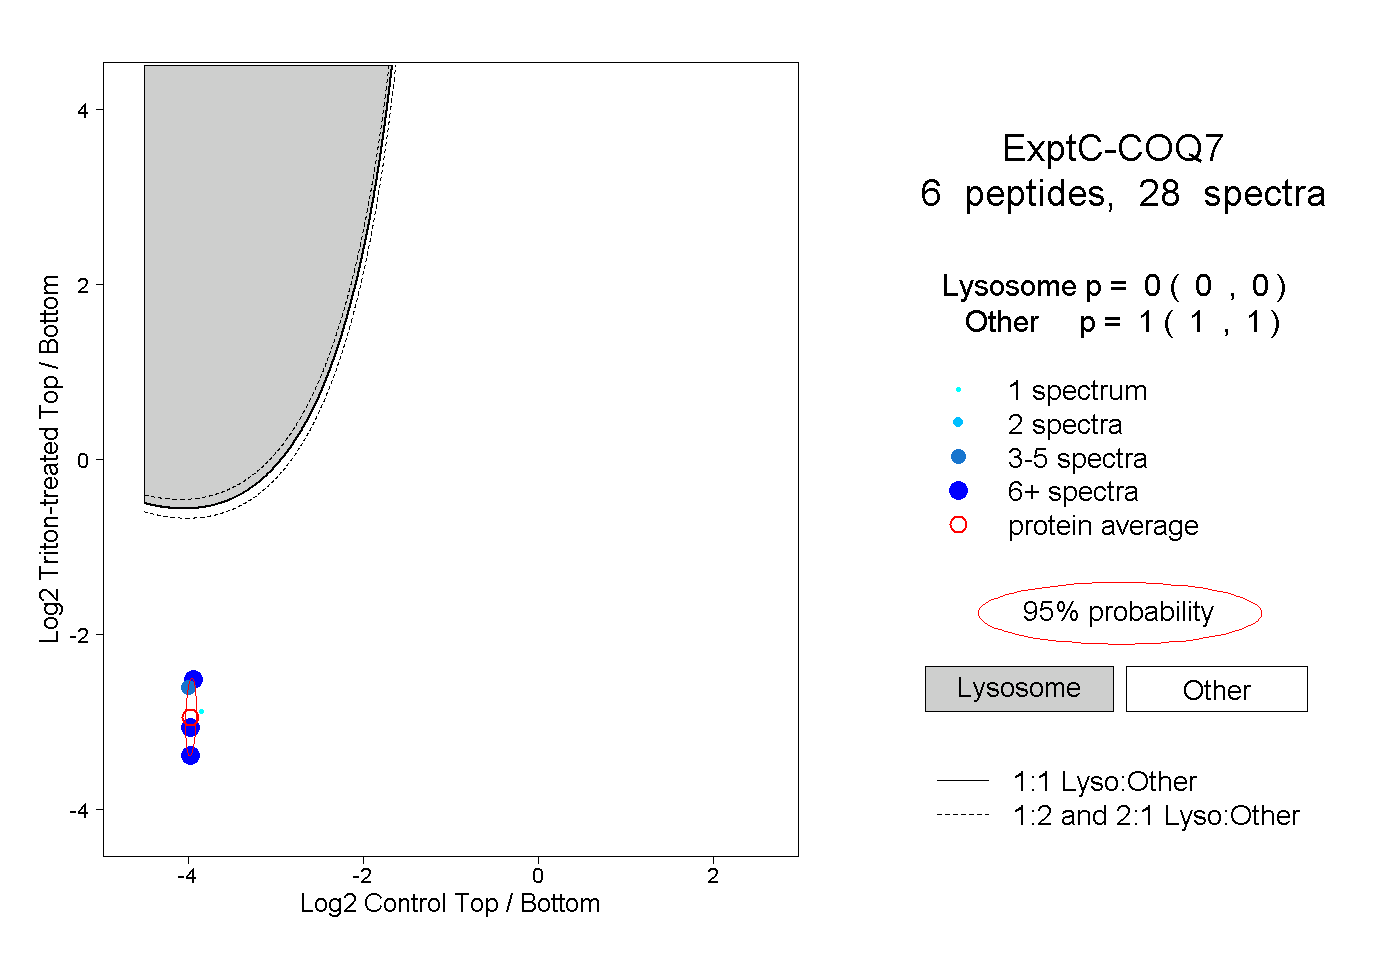
0.000 | 0.000
1.000 | 1.000
3peptides
spectra
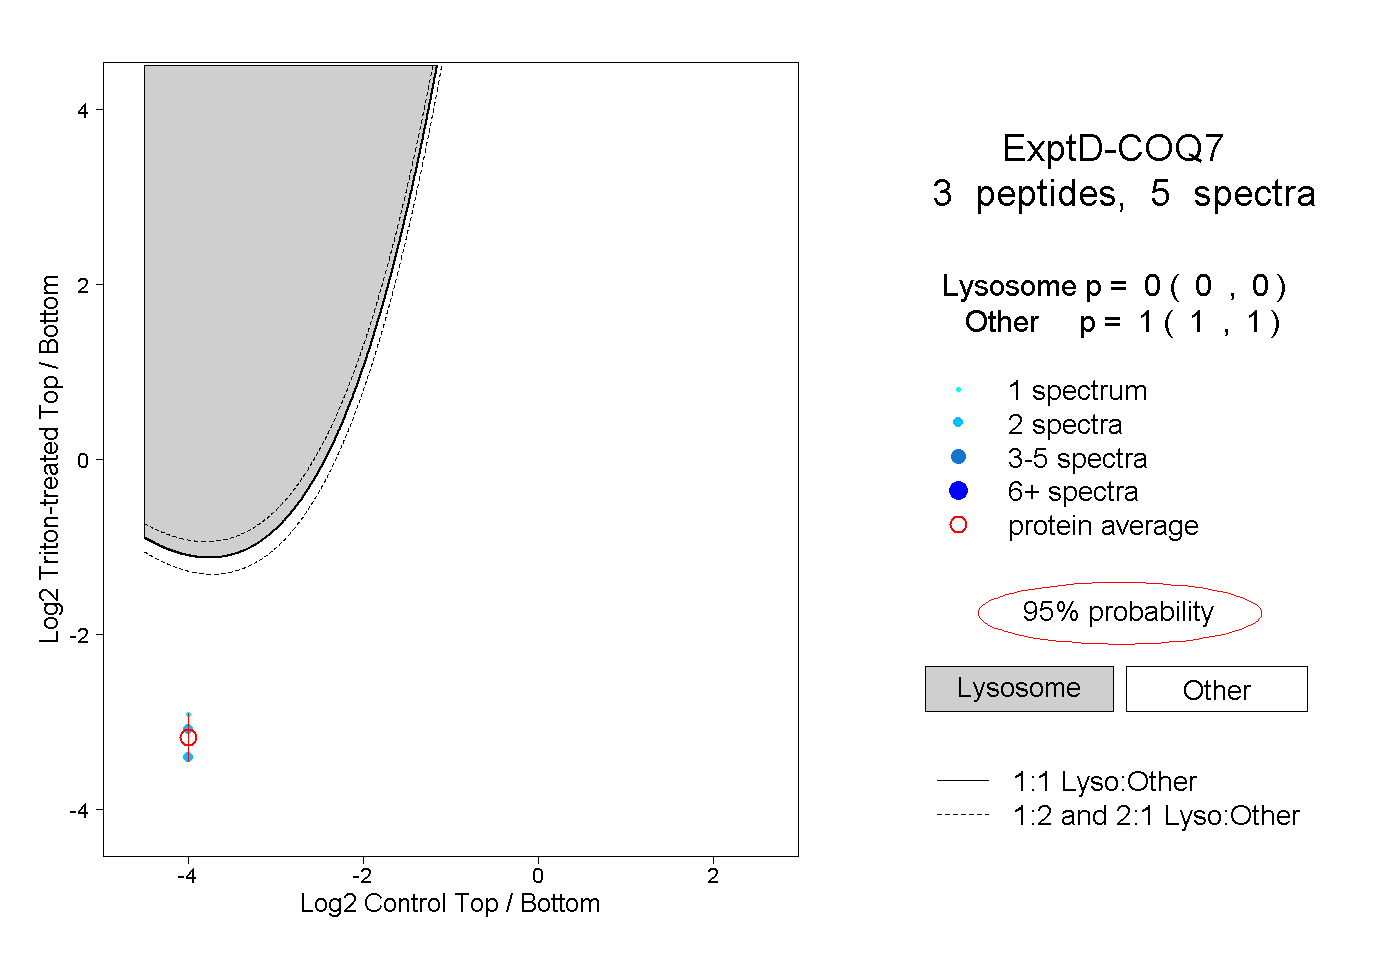
0.000 | 0.000
1.000 | 1.000