 2
2peptides
spectra
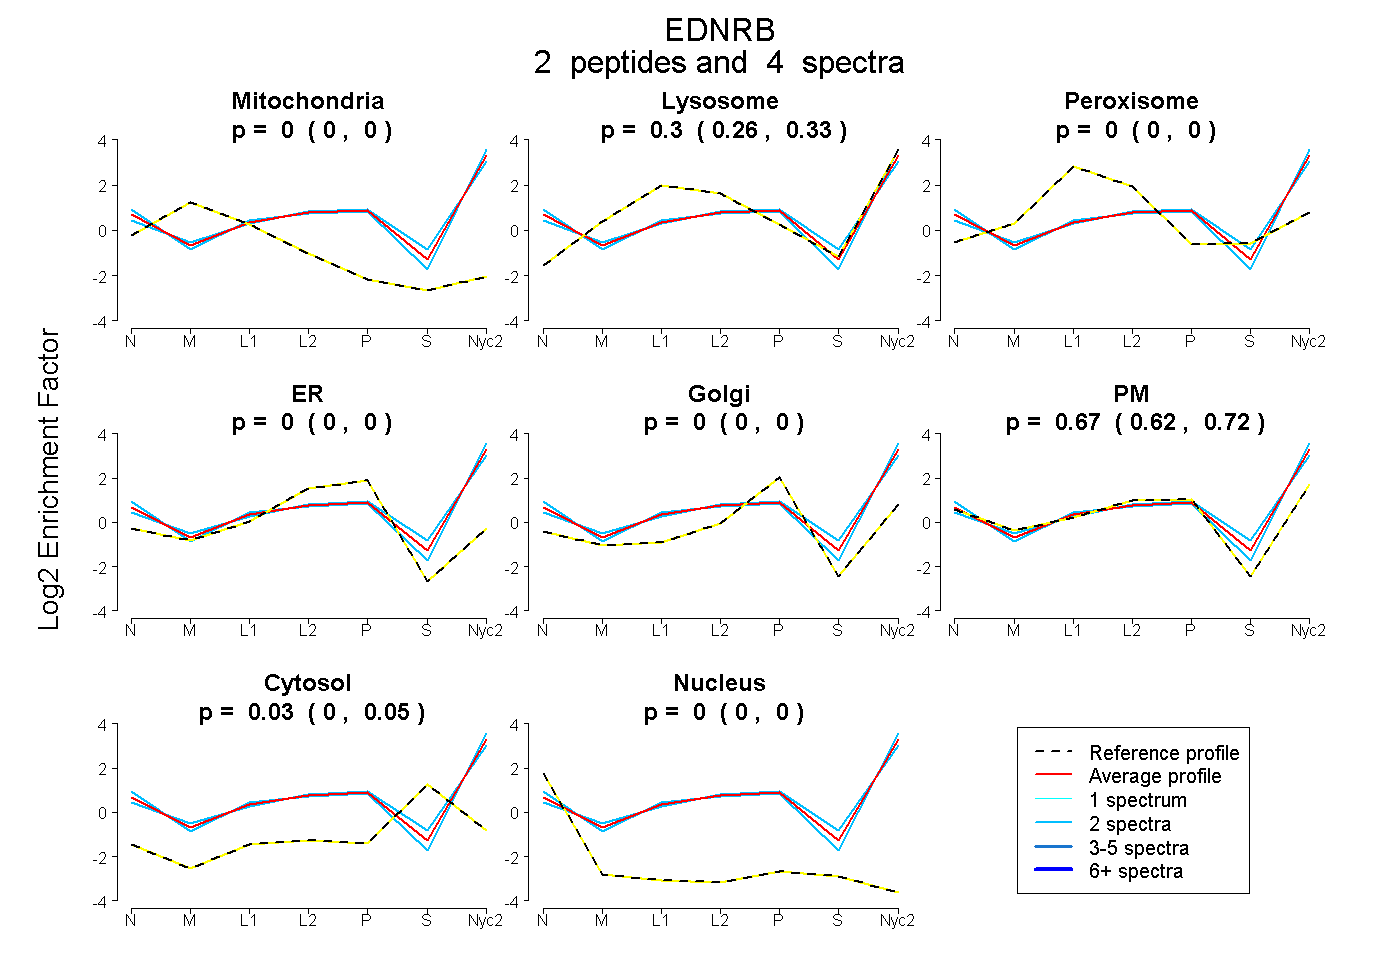
0.000 | 0.000
0.258 | 0.328
0.000 | 0.000
0.000 | 0.000
0.000 | 0.000
0.620 | 0.717
0.005 | 0.054
0.000 | 0.000
6peptides
spectra
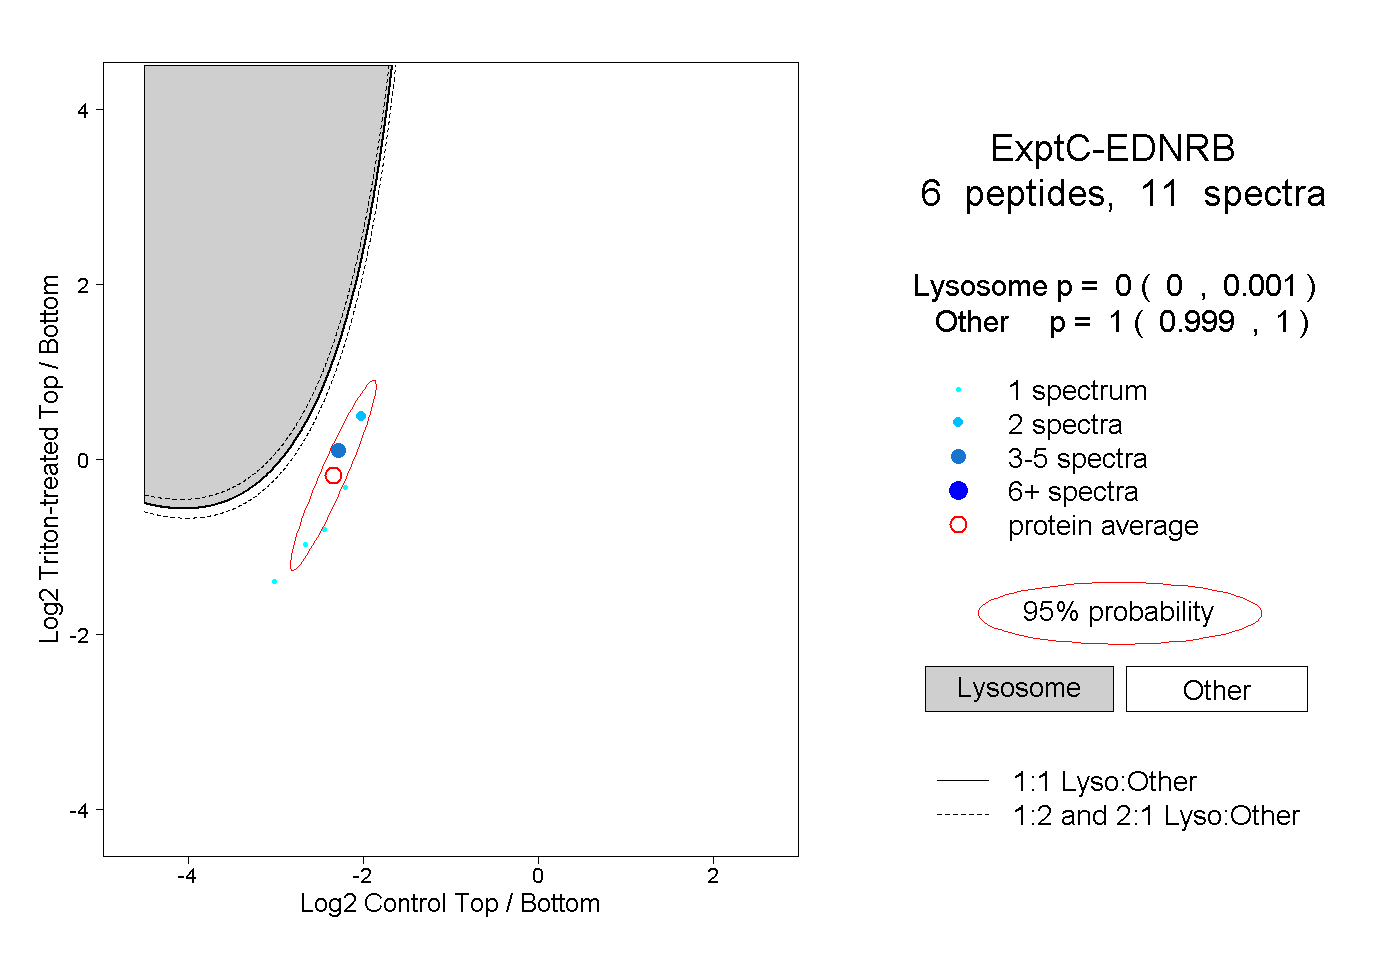
0.000 | 0.001
0.999 | 1.000
1peptide
spectrum
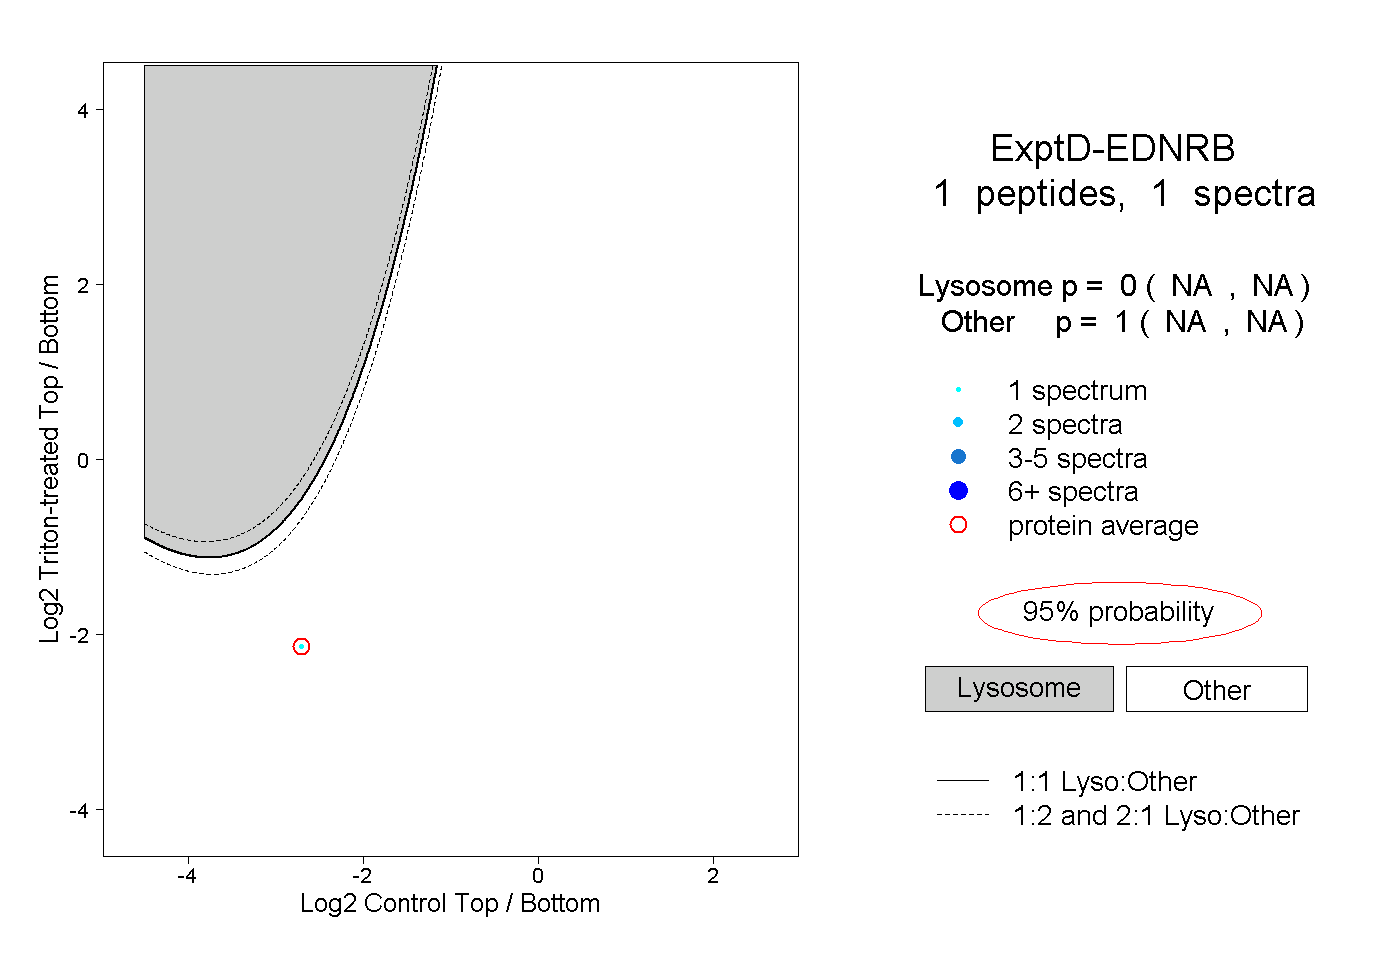
NA | NA
NA | NA