 59
59peptides
spectra
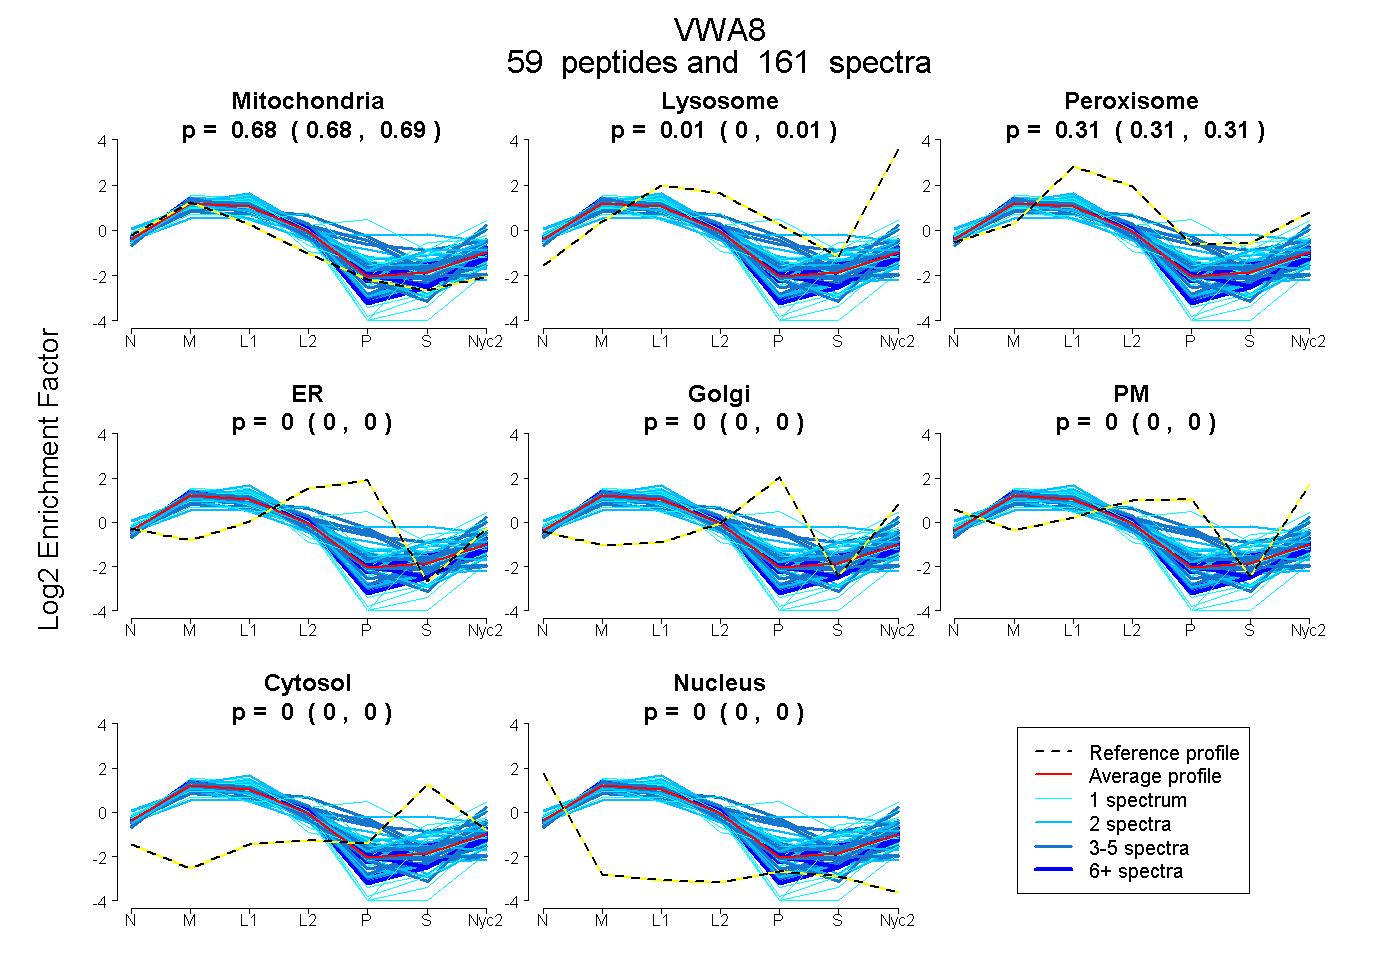
0.683 | 0.686
0.003 | 0.009
0.306 | 0.312
0.000 | 0.000
0.000 | 0.000
0.000 | 0.000
0.000 | 0.000
0.000 | 0.000
40peptides
spectra
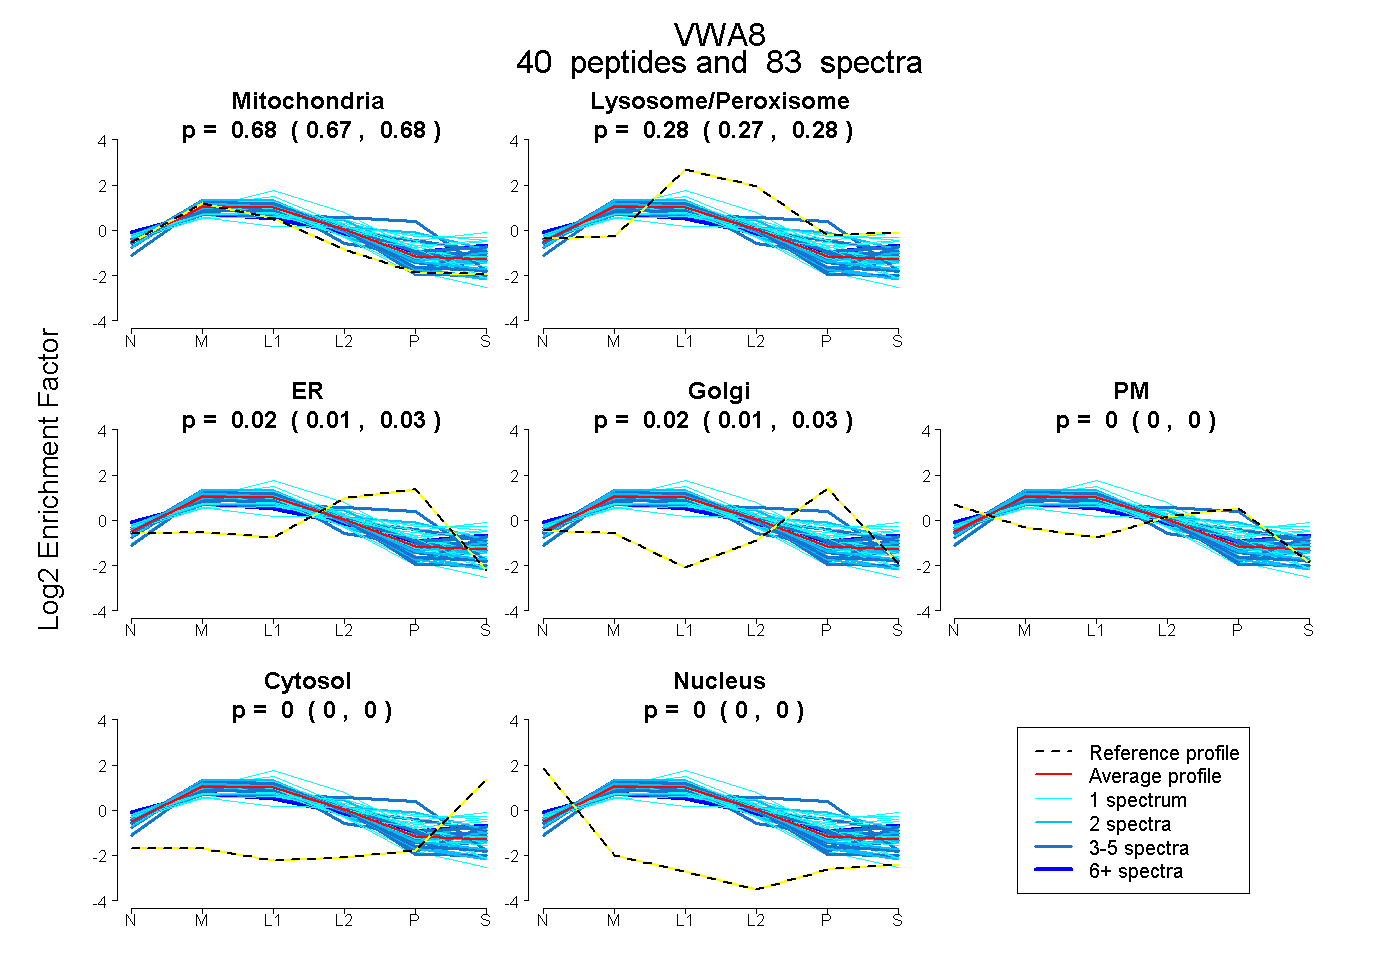
0.674 | 0.684
0.272 | 0.284
0.008 | 0.030
0.012 | 0.031
0.000 | 0.000
0.000 | 0.000
0.000 | 0.000
93peptides
spectra
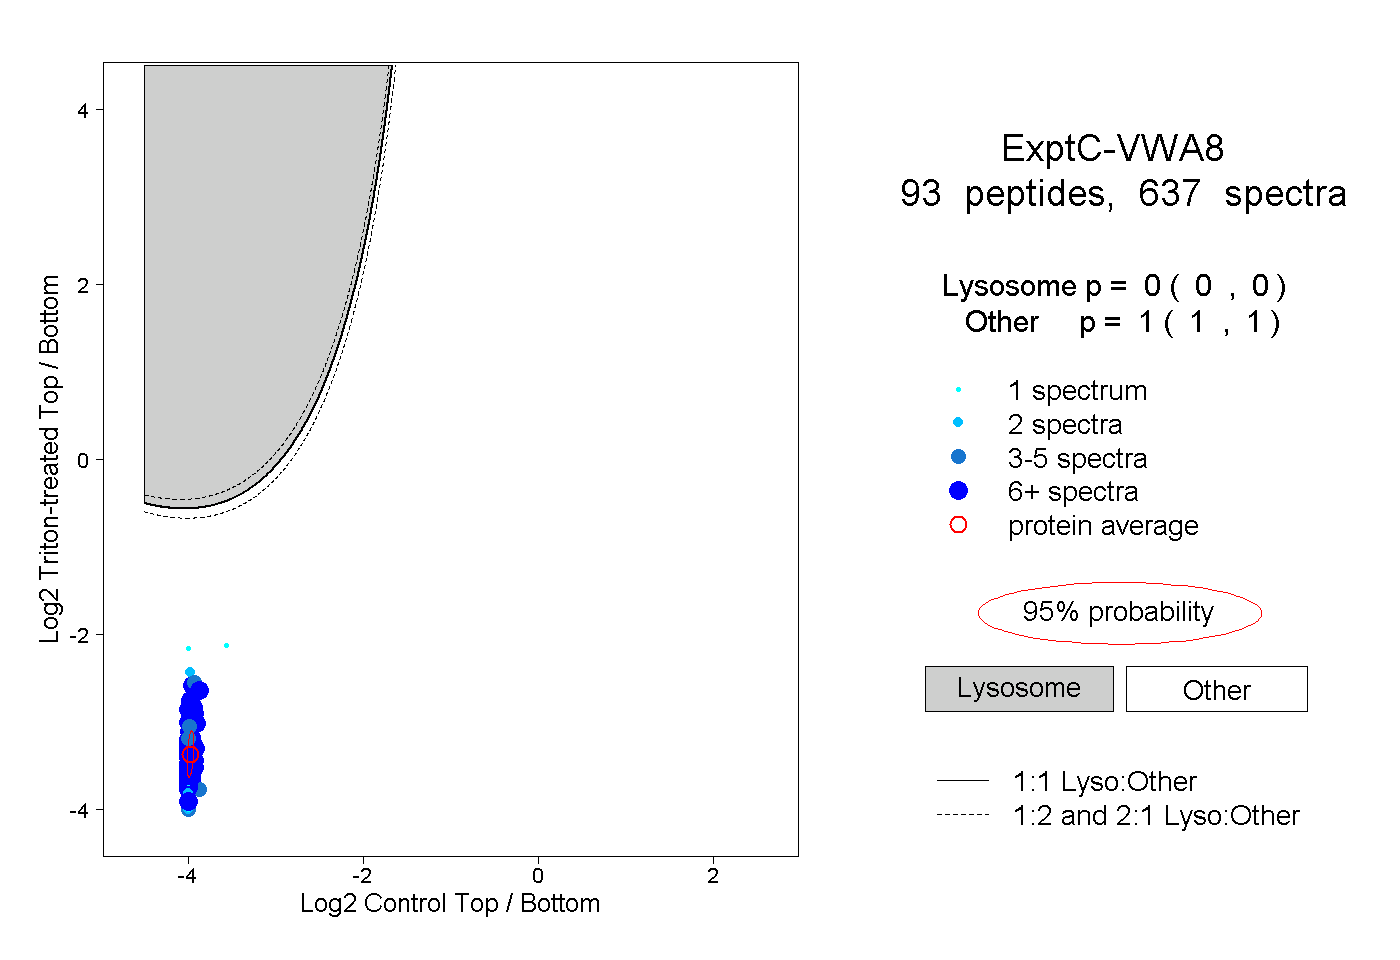
0.000 | 0.000
1.000 | 1.000
36peptides
spectra
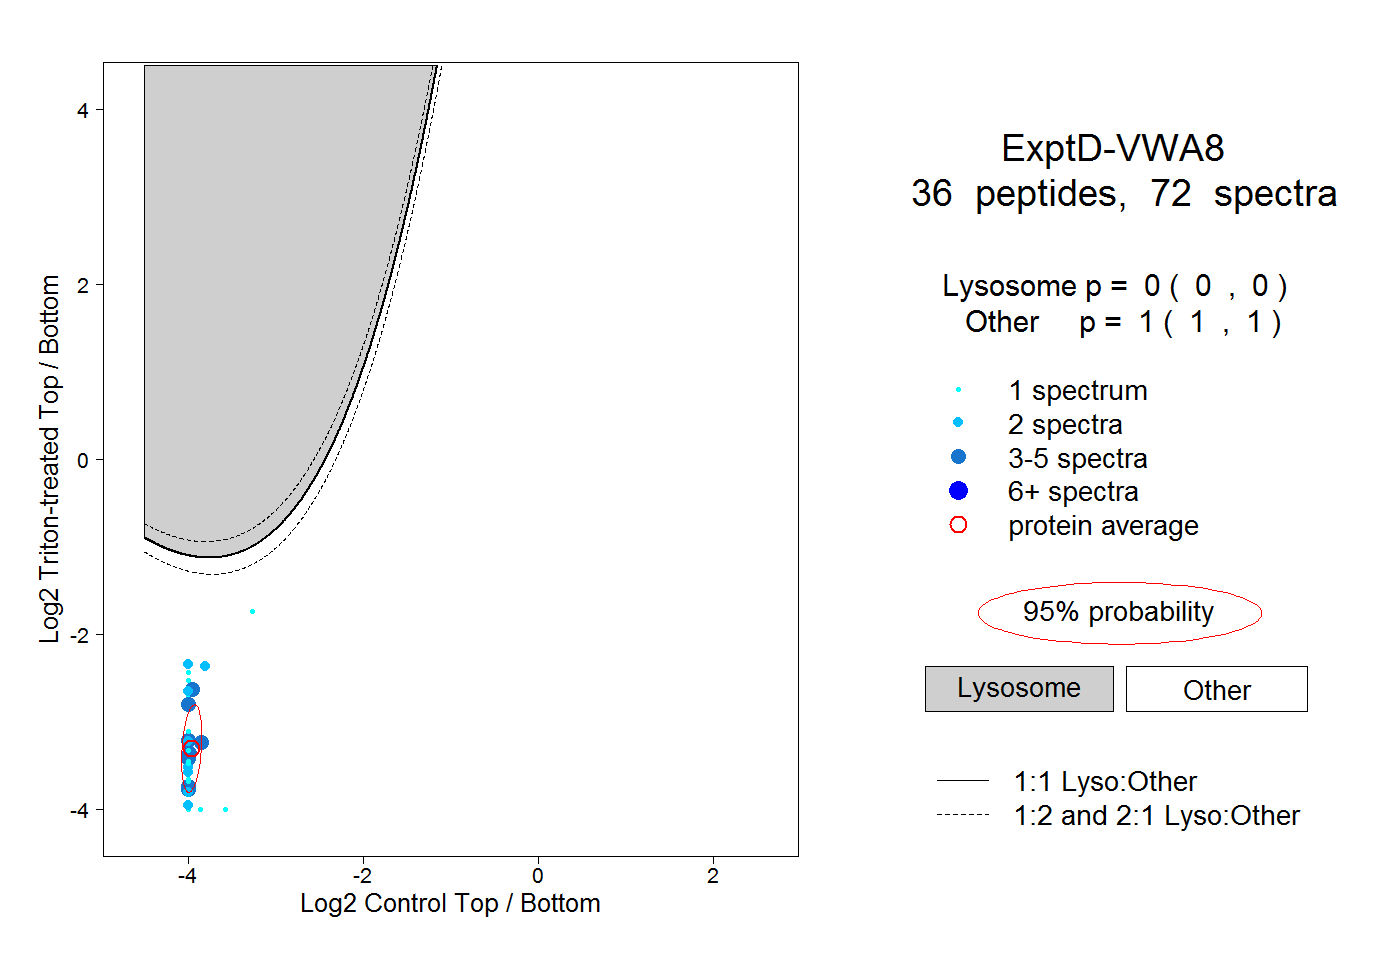
0.000 | 0.000
1.000 | 1.000