 13
13peptides
spectra
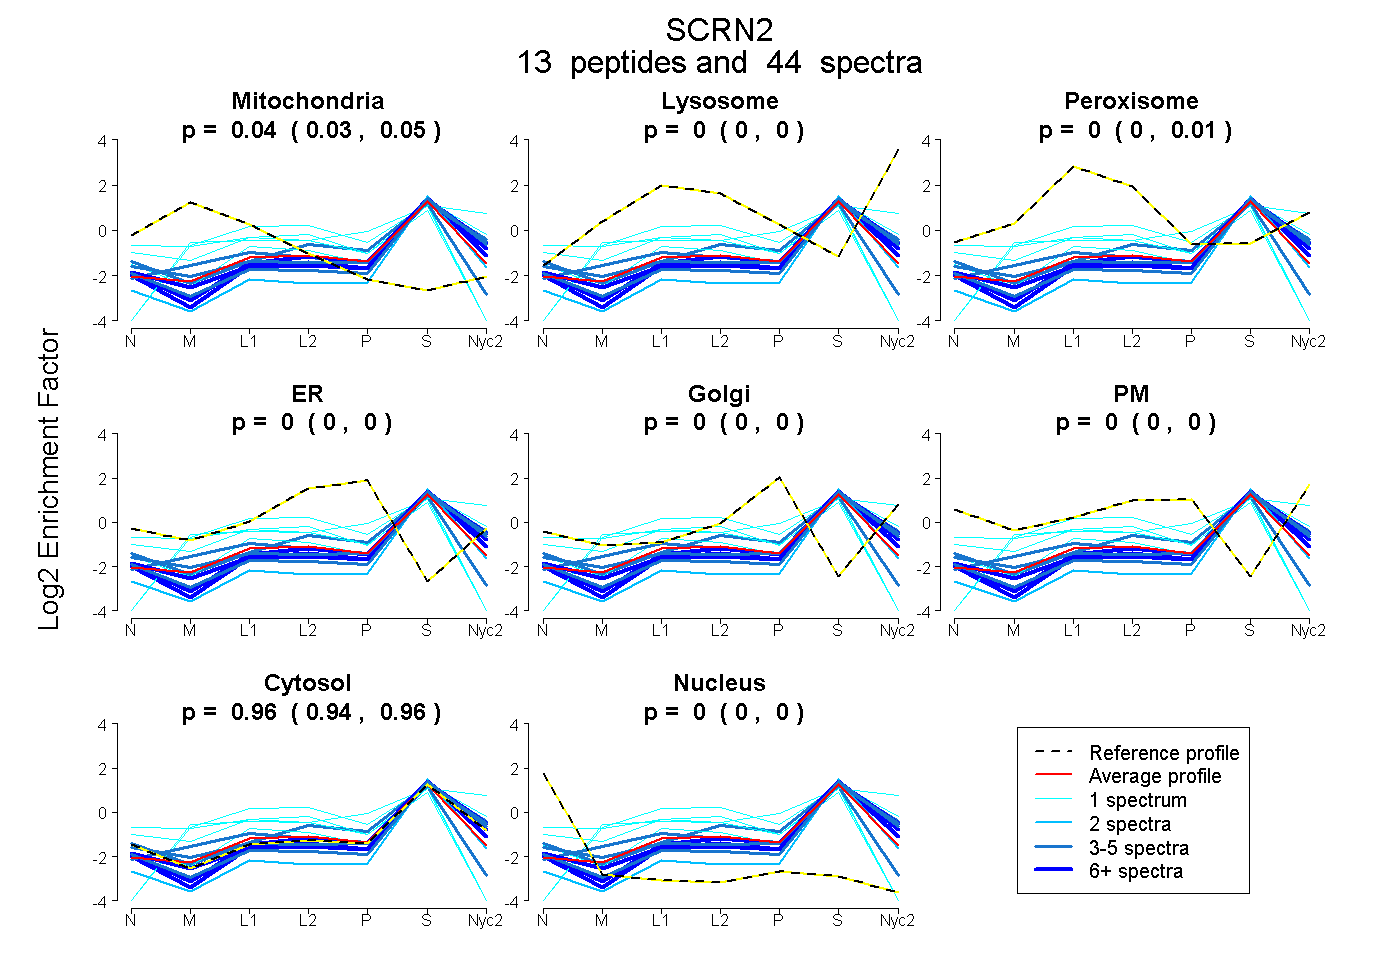
0.031 | 0.053
0.000 | 0.000
0.000 | 0.007
0.000 | 0.000
0.000 | 0.000
0.000 | 0.000
0.945 | 0.963
0.000 | 0.000
6peptides
spectra
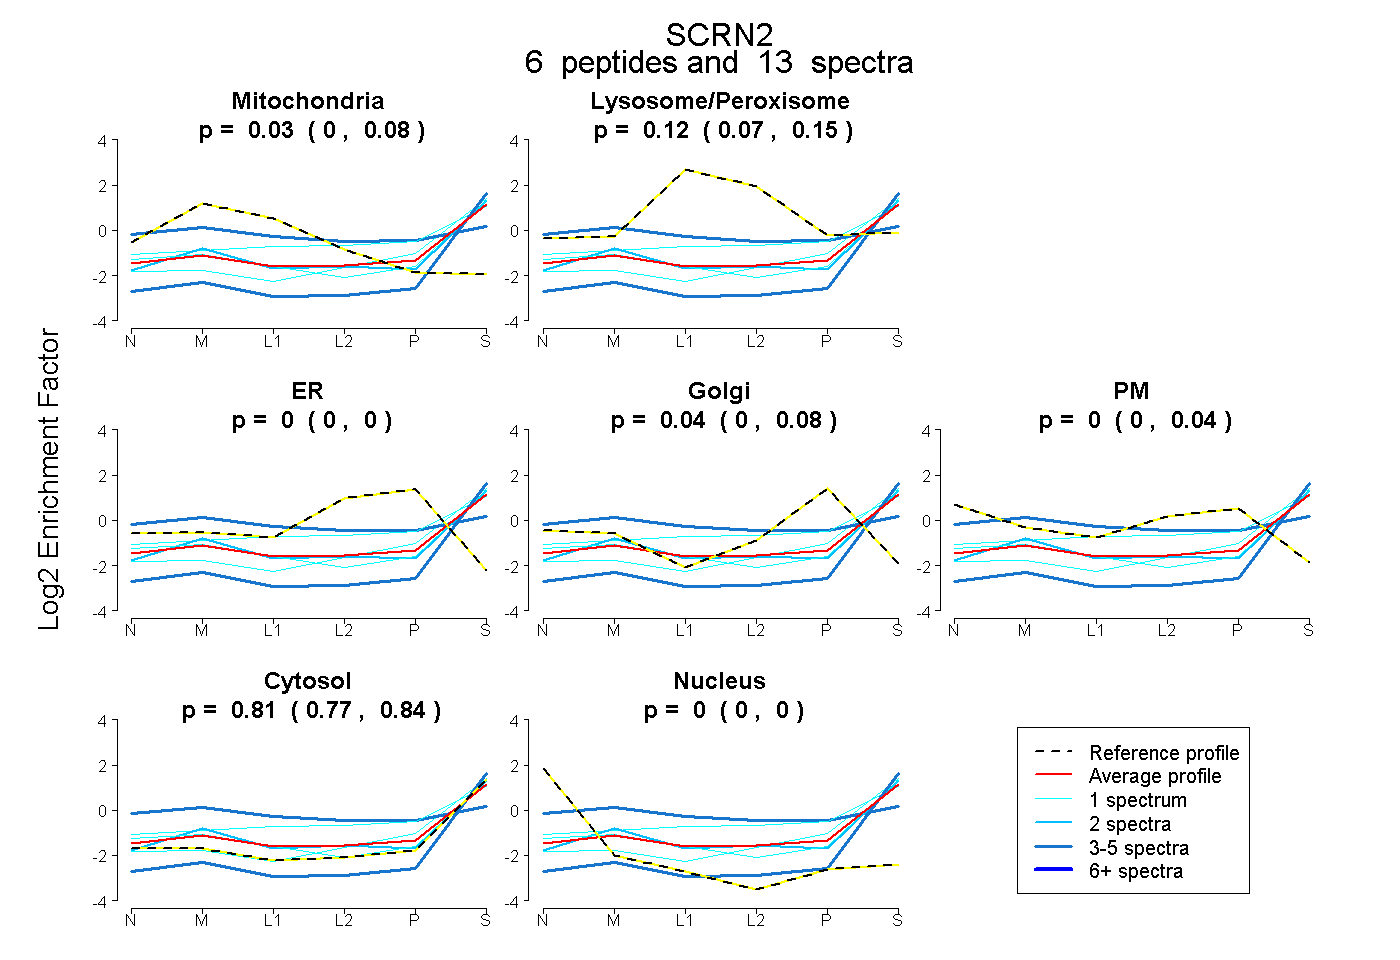
0.000 | 0.077
0.069 | 0.150
0.000 | 0.000
0.000 | 0.080
0.000 | 0.041
0.770 | 0.837
0.000 | 0.000
6peptides
spectra
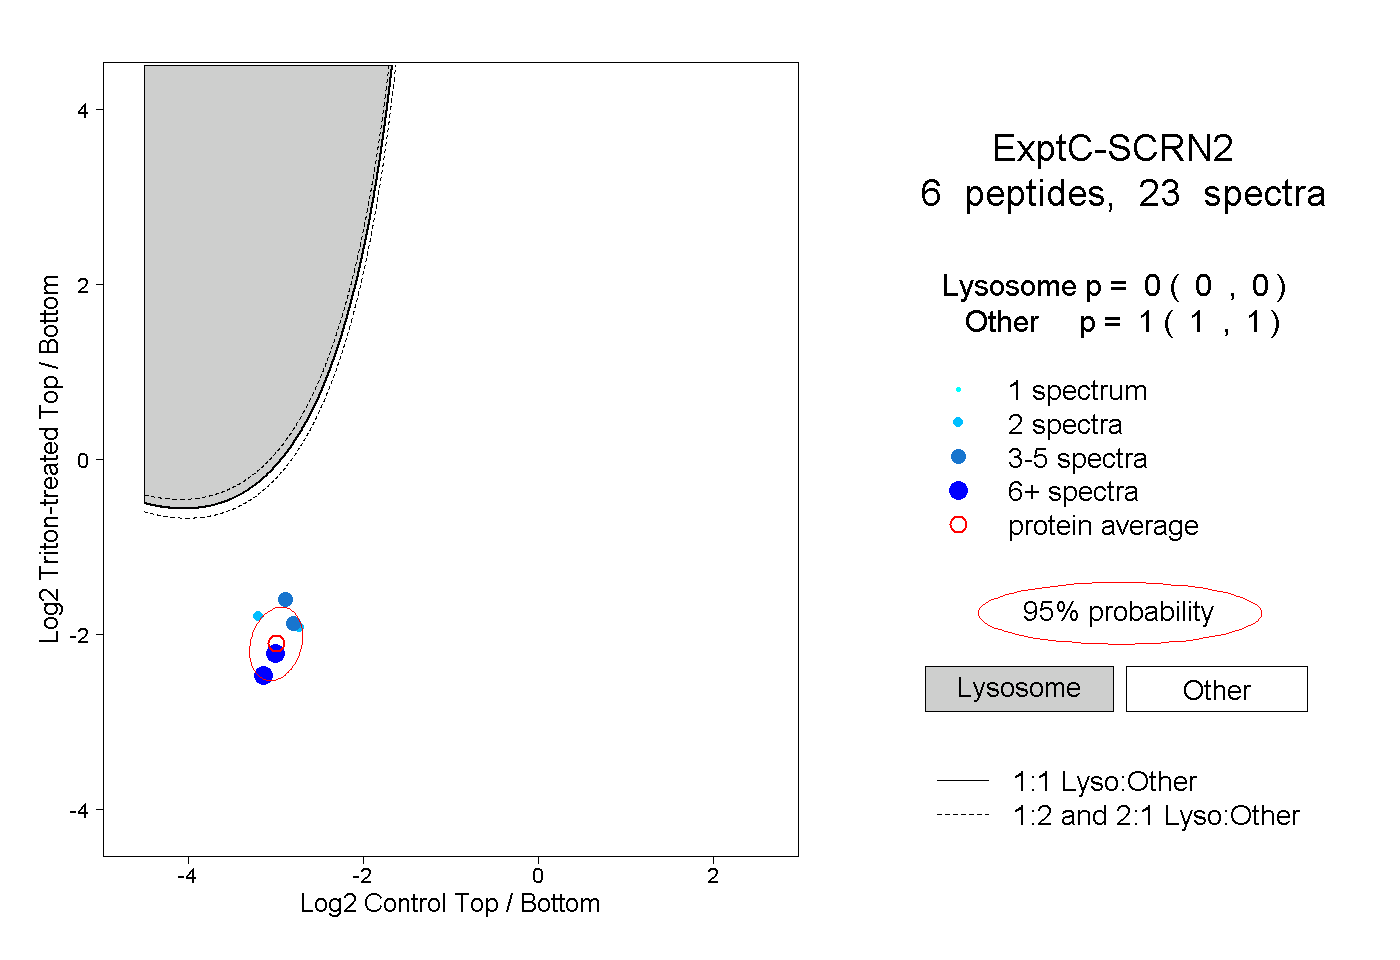
0.000 | 0.000
1.000 | 1.000
2peptides
spectra
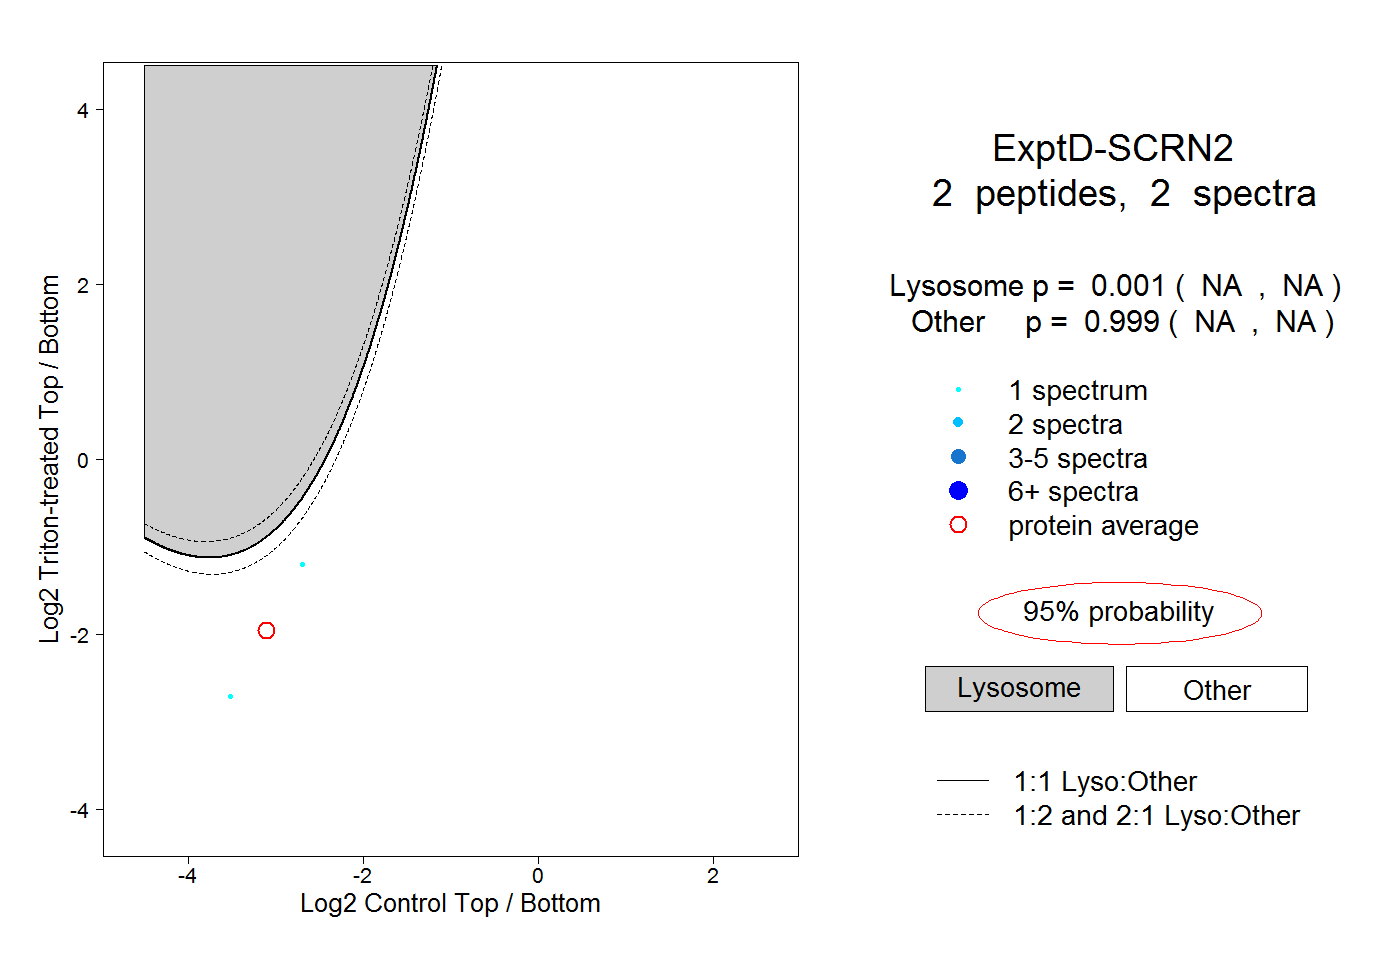
NA | NA
NA | NA