 8
8peptides
spectra
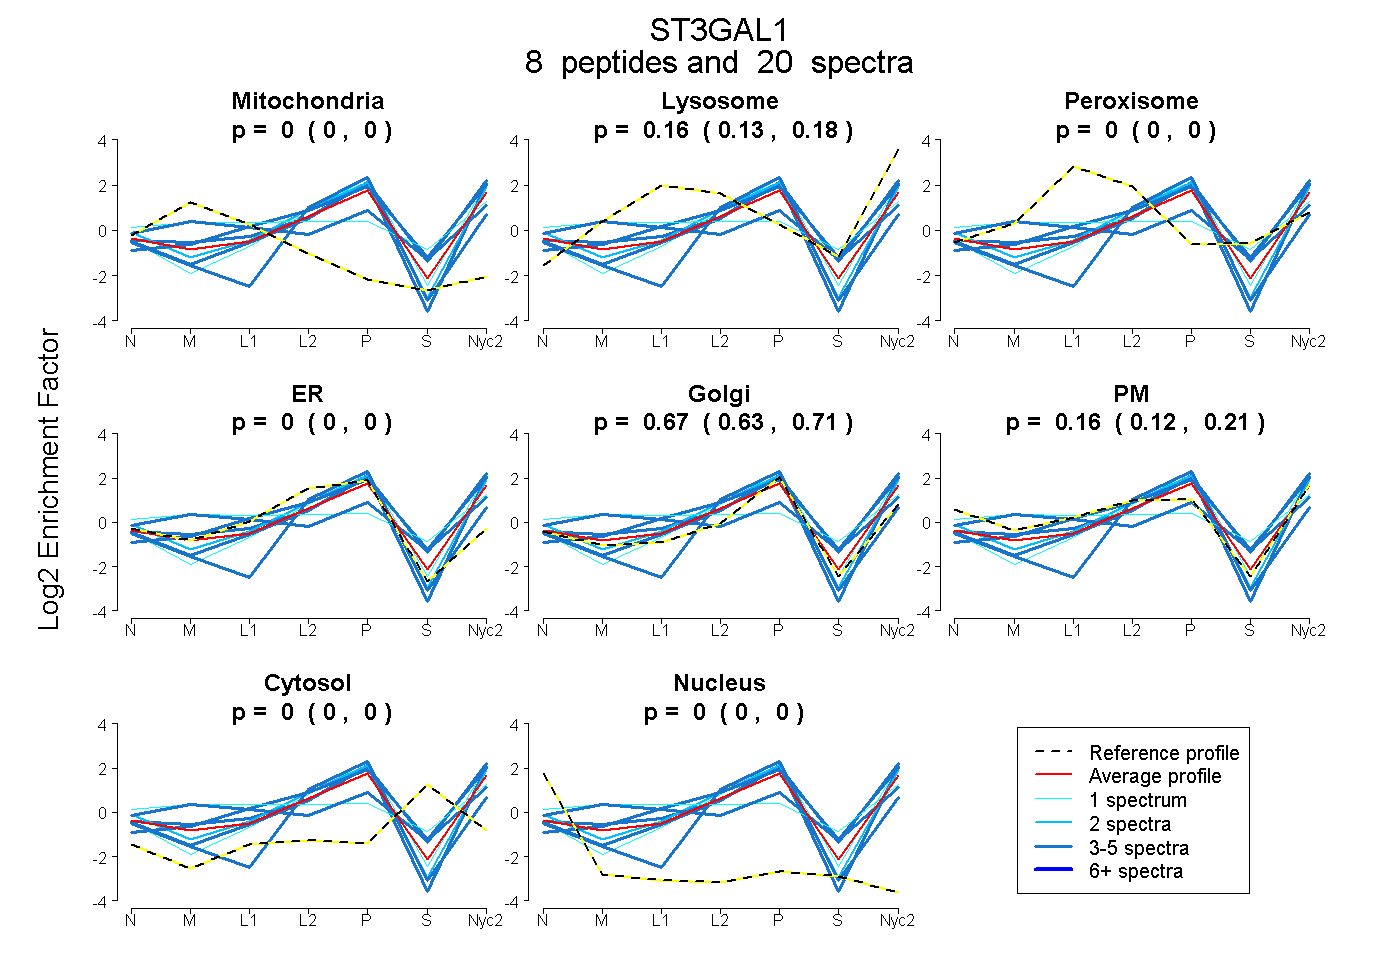
0.000 | 0.000
0.135 | 0.184
0.000 | 0.000
0.000 | 0.000
0.633 | 0.707
0.117 | 0.206
0.000 | 0.000
0.000 | 0.000
9peptides
spectra
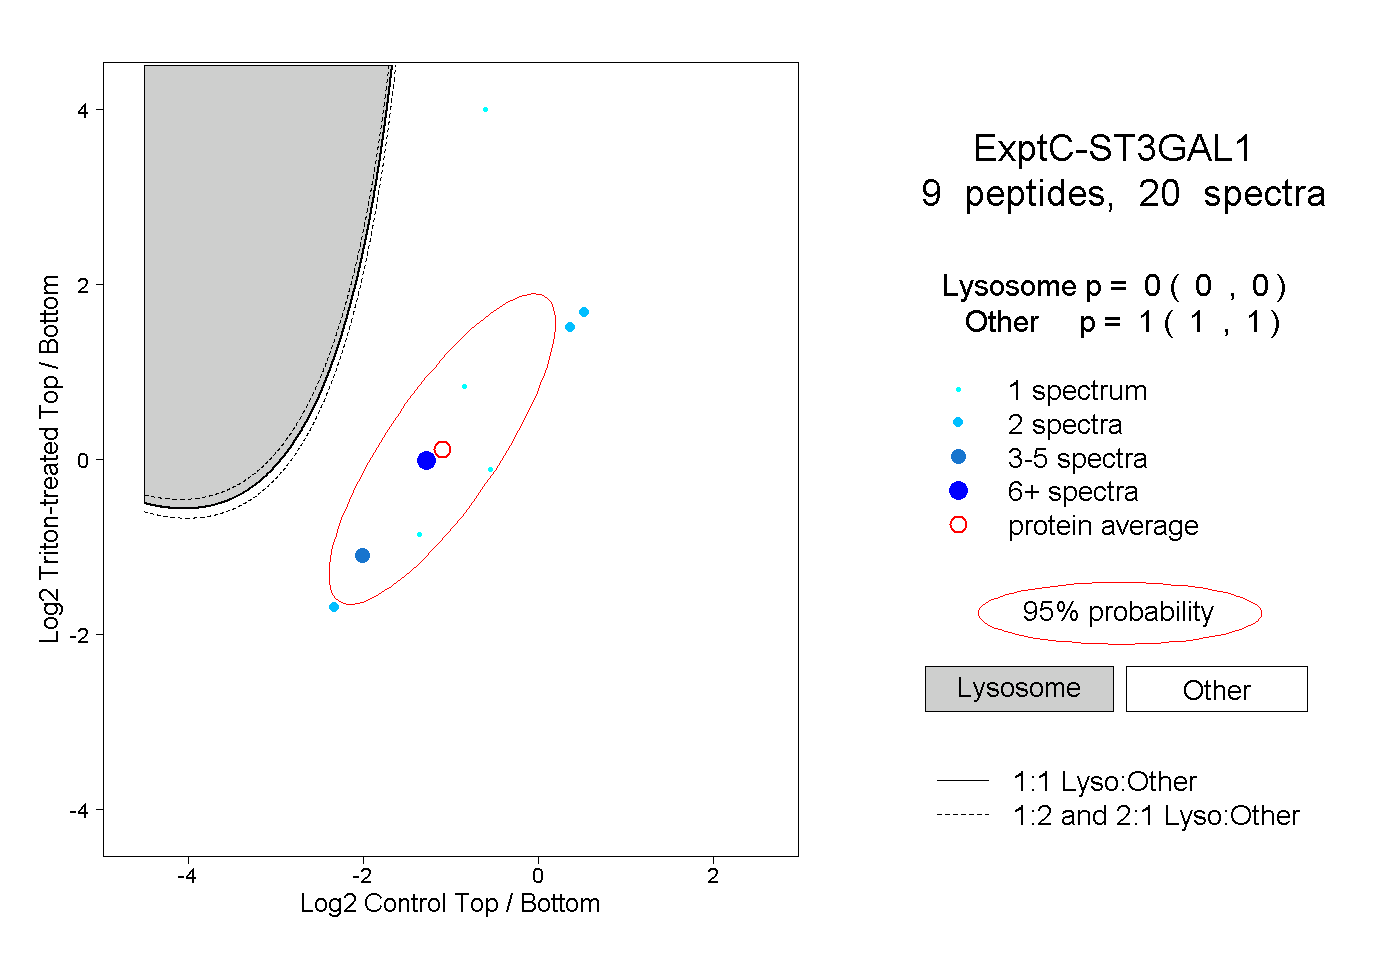
0.000 | 0.000
1.000 | 1.000
1peptide
spectrum
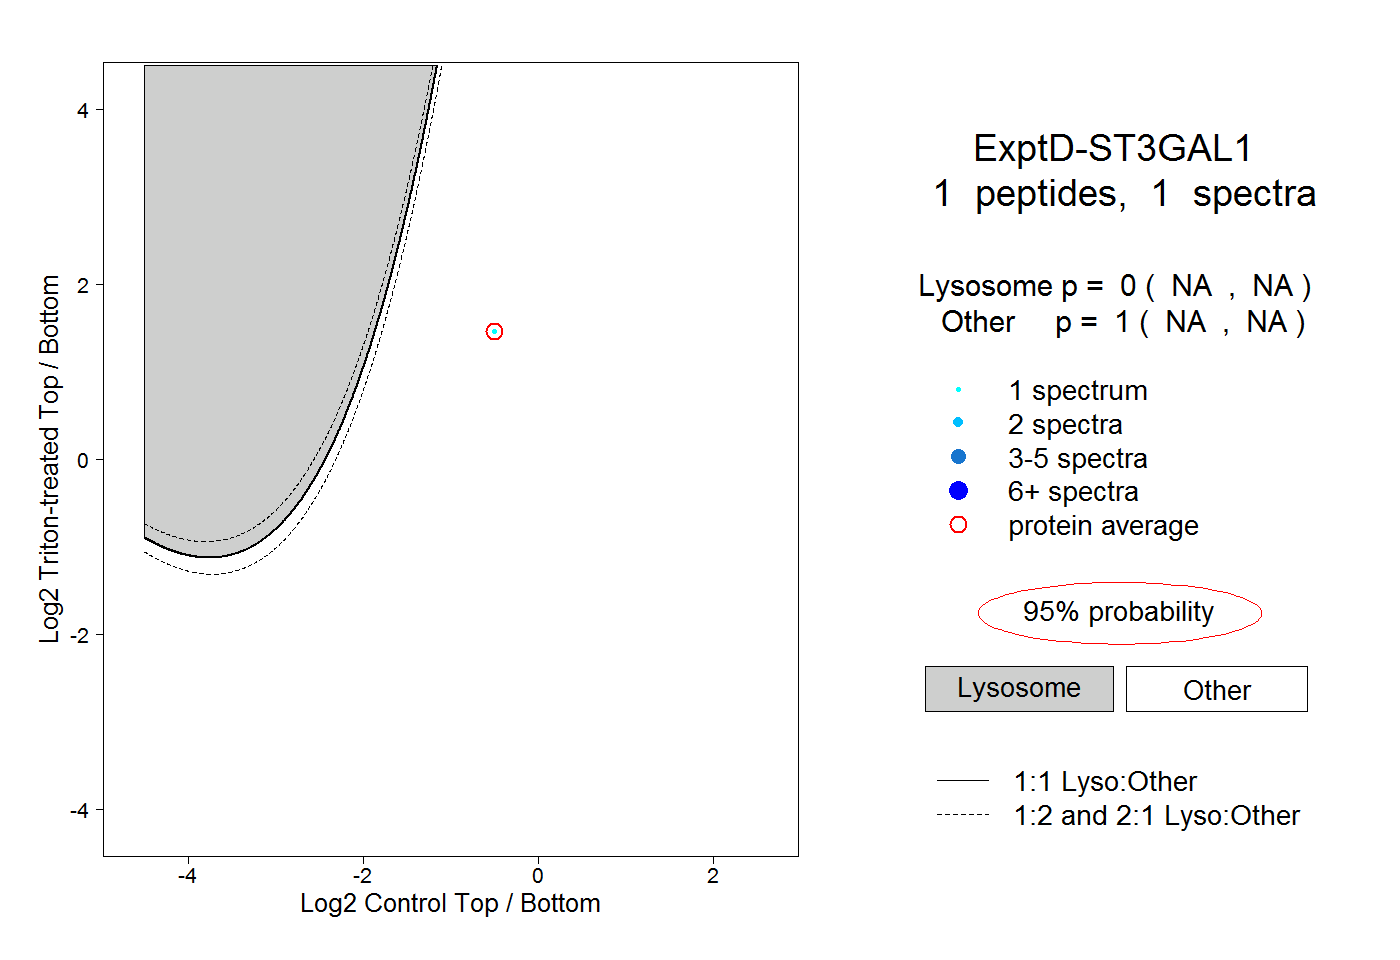
NA | NA
NA | NA