 5
5peptides
spectra
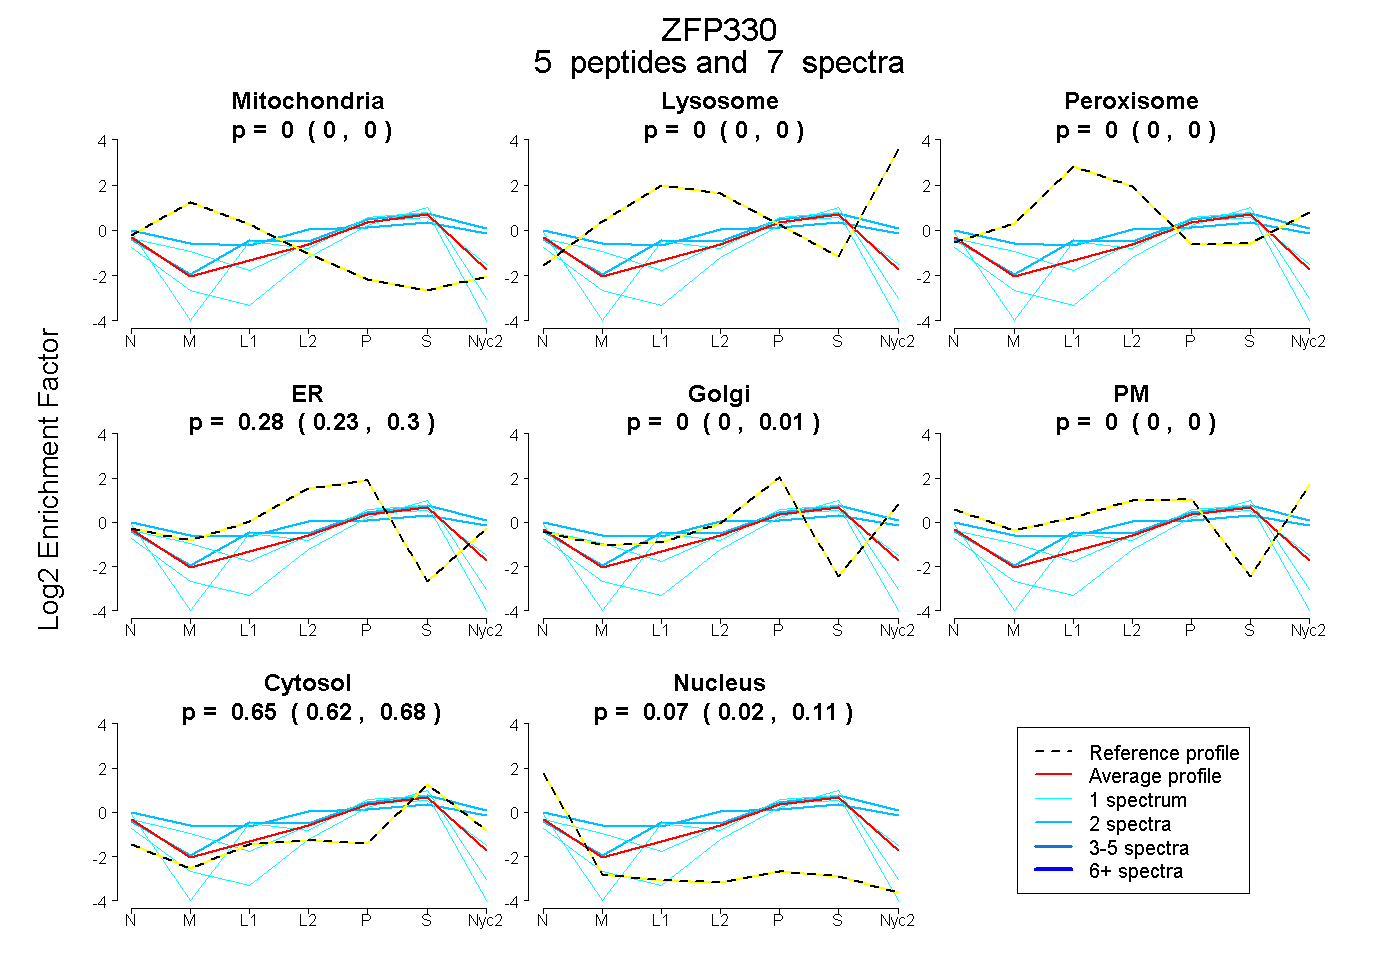
0.000 | 0.000
0.000 | 0.000
0.000 | 0.000
0.228 | 0.303
0.000 | 0.006
0.000 | 0.000
0.619 | 0.682
0.021 | 0.110
1peptide
spectra
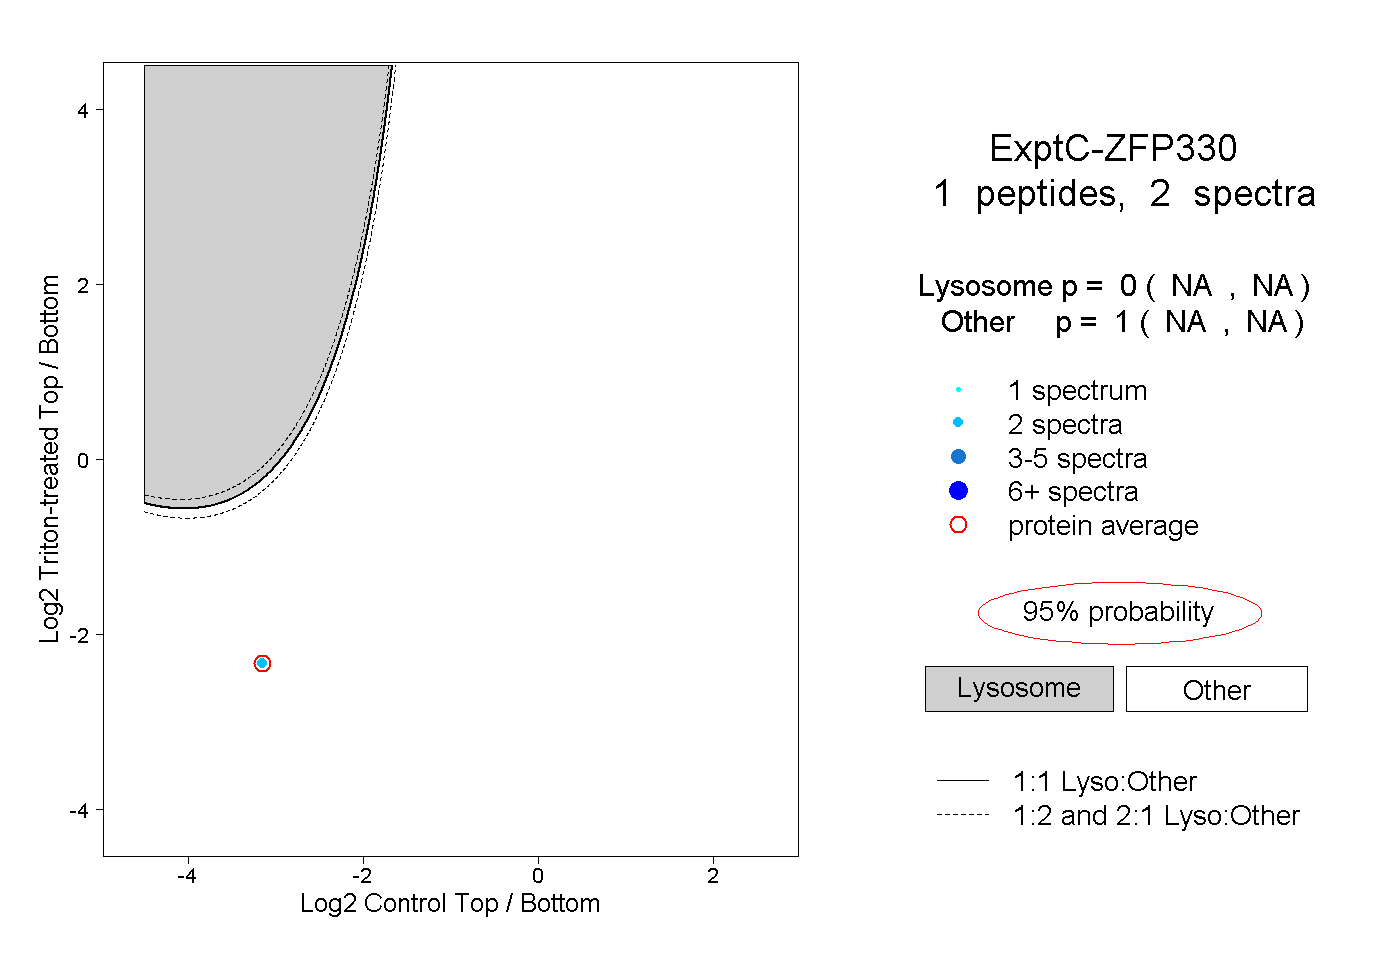
NA | NA
NA | NA
1peptide
spectrum
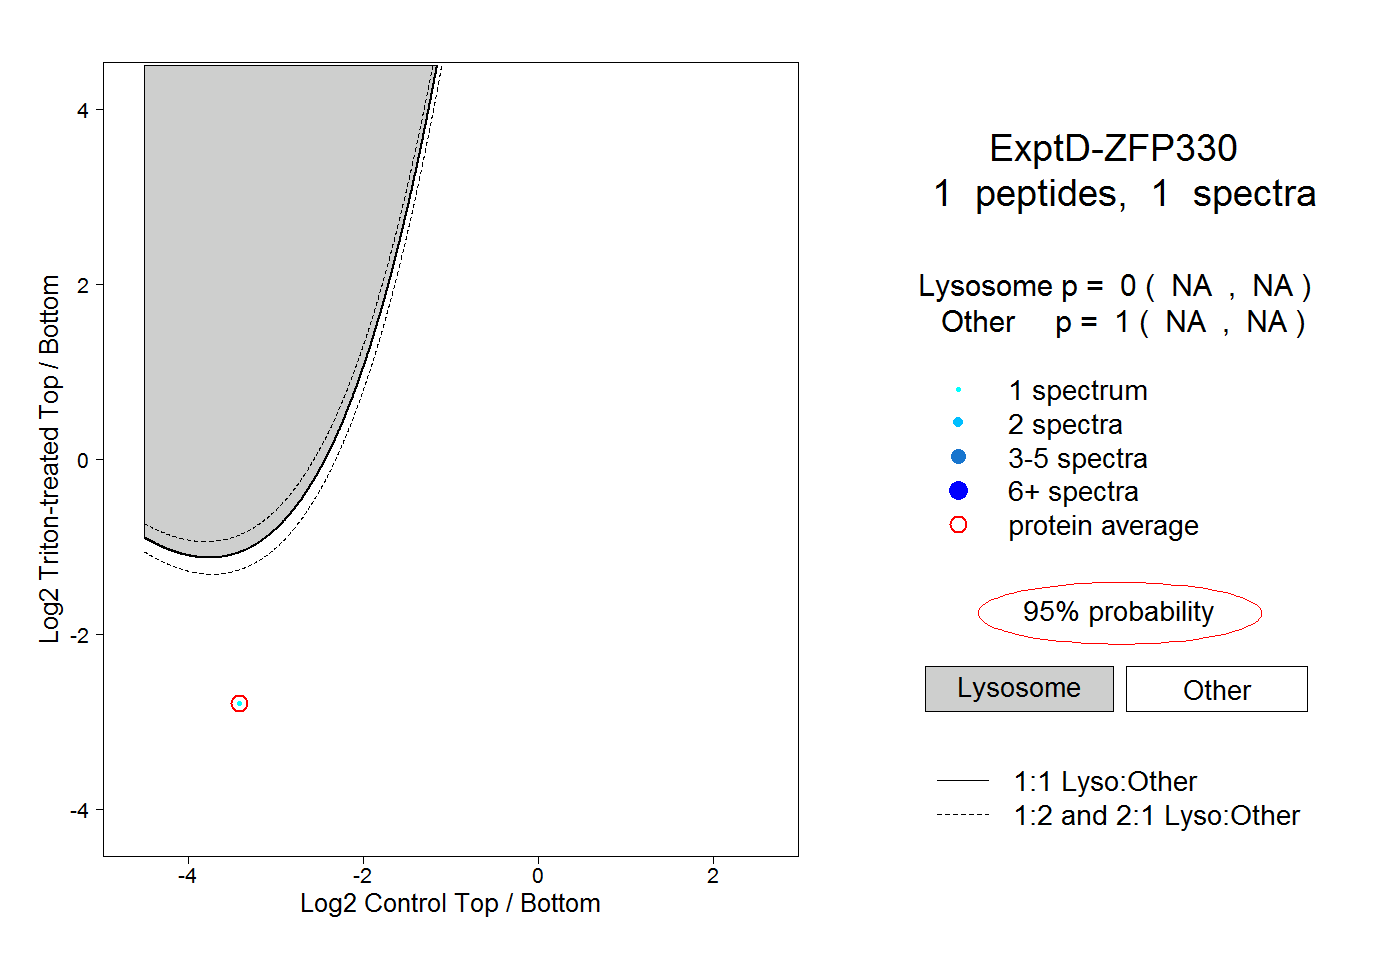
NA | NA
NA | NA