 4
4peptides
spectra
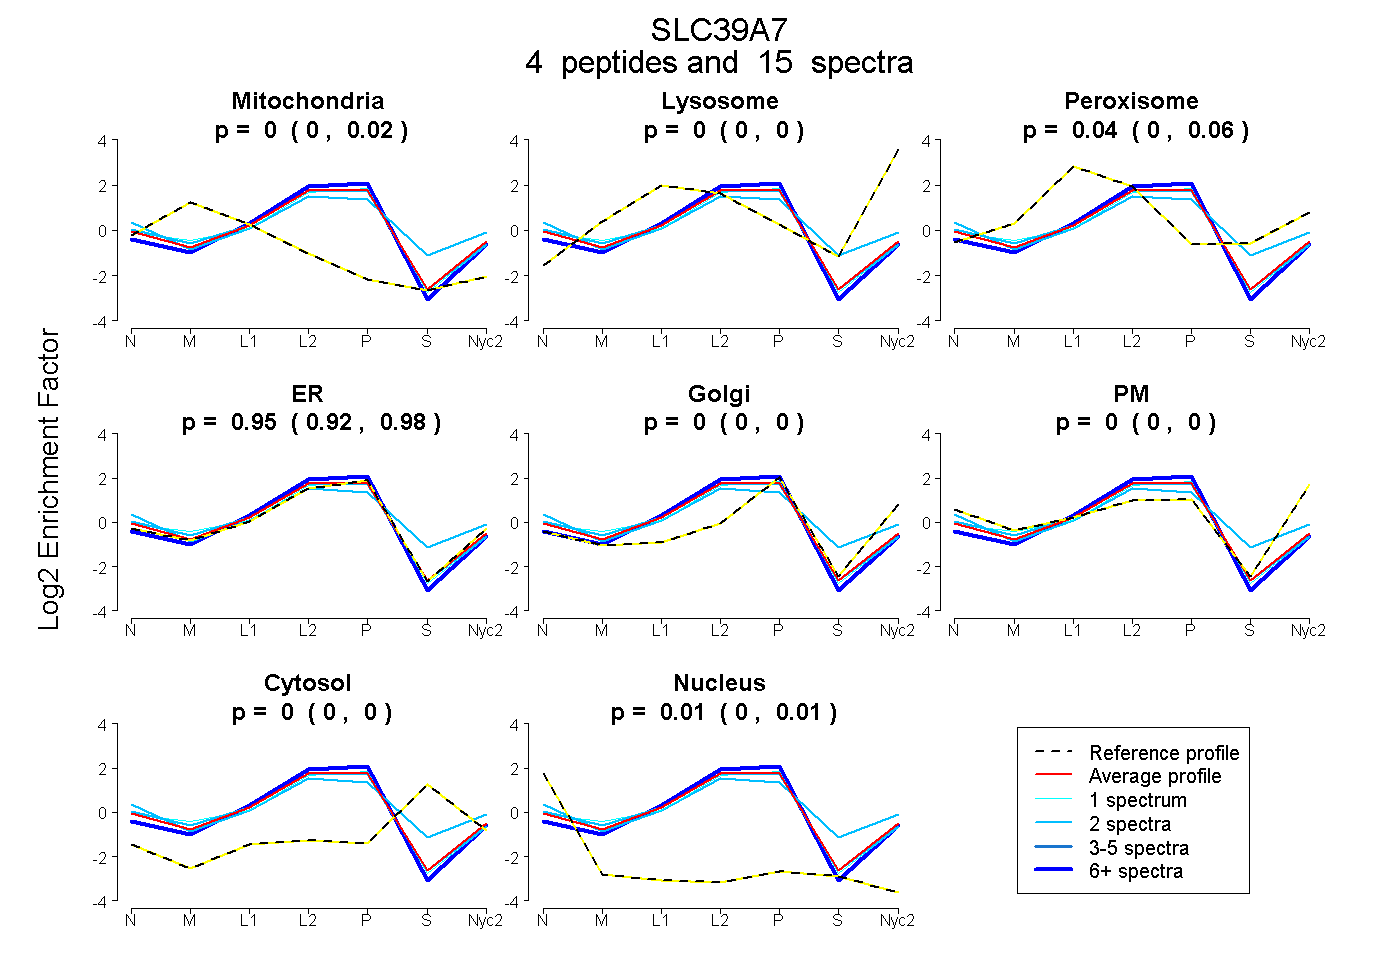
0.000 | 0.023
0.000 | 0.000
0.001 | 0.062
0.923 | 0.976
0.000 | 0.000
0.000 | 0.000
0.000 | 0.000
0.000 | 0.015
1peptide
spectra
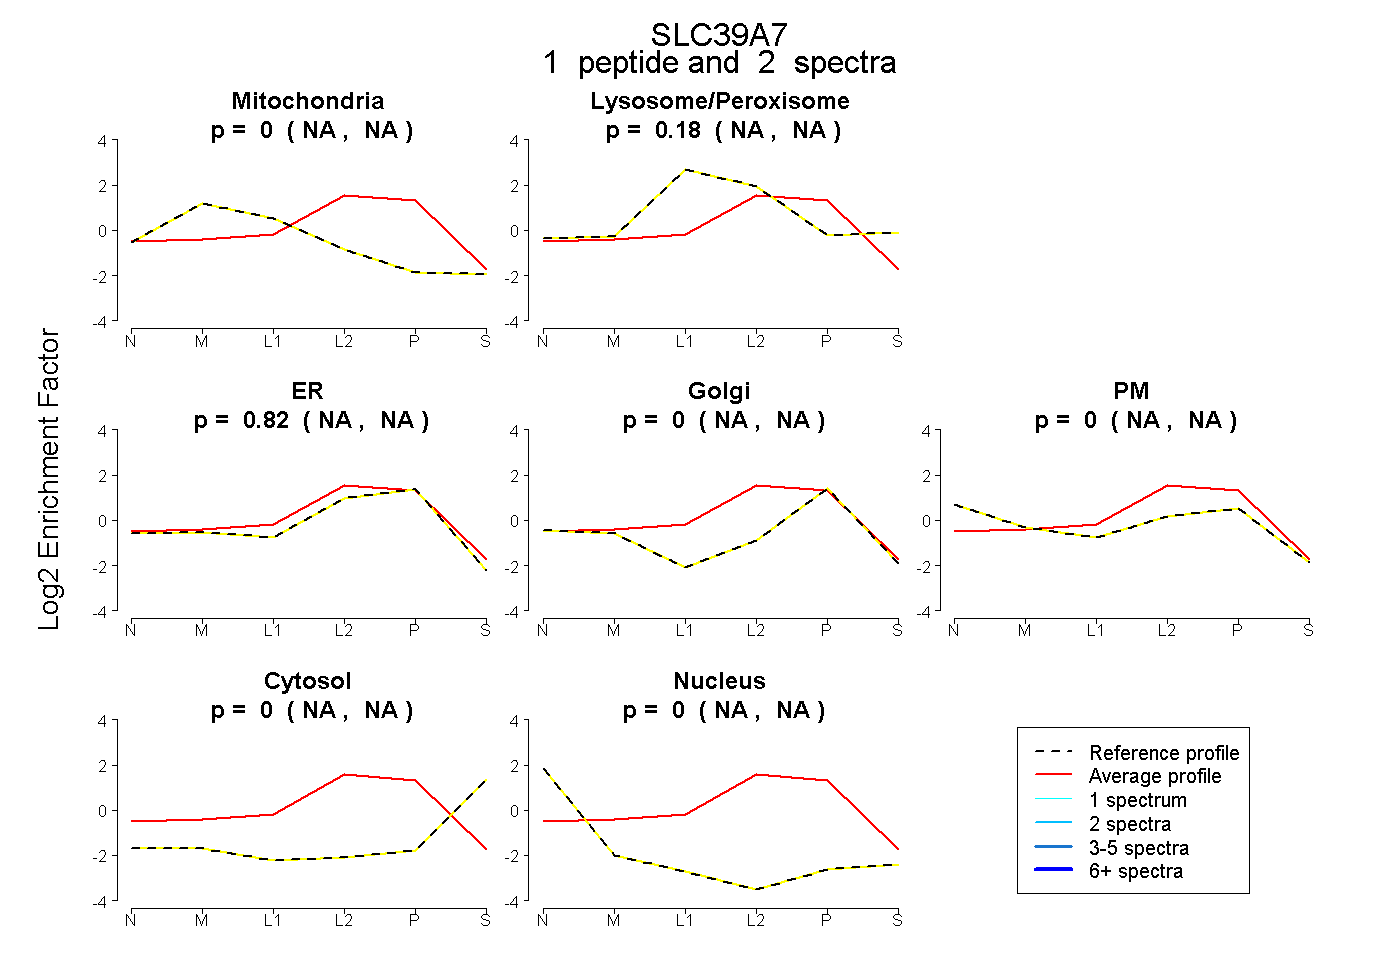
NA | NA
NA | NA
NA | NA
NA | NA
NA | NA
NA | NA
NA | NA
4peptides
spectra
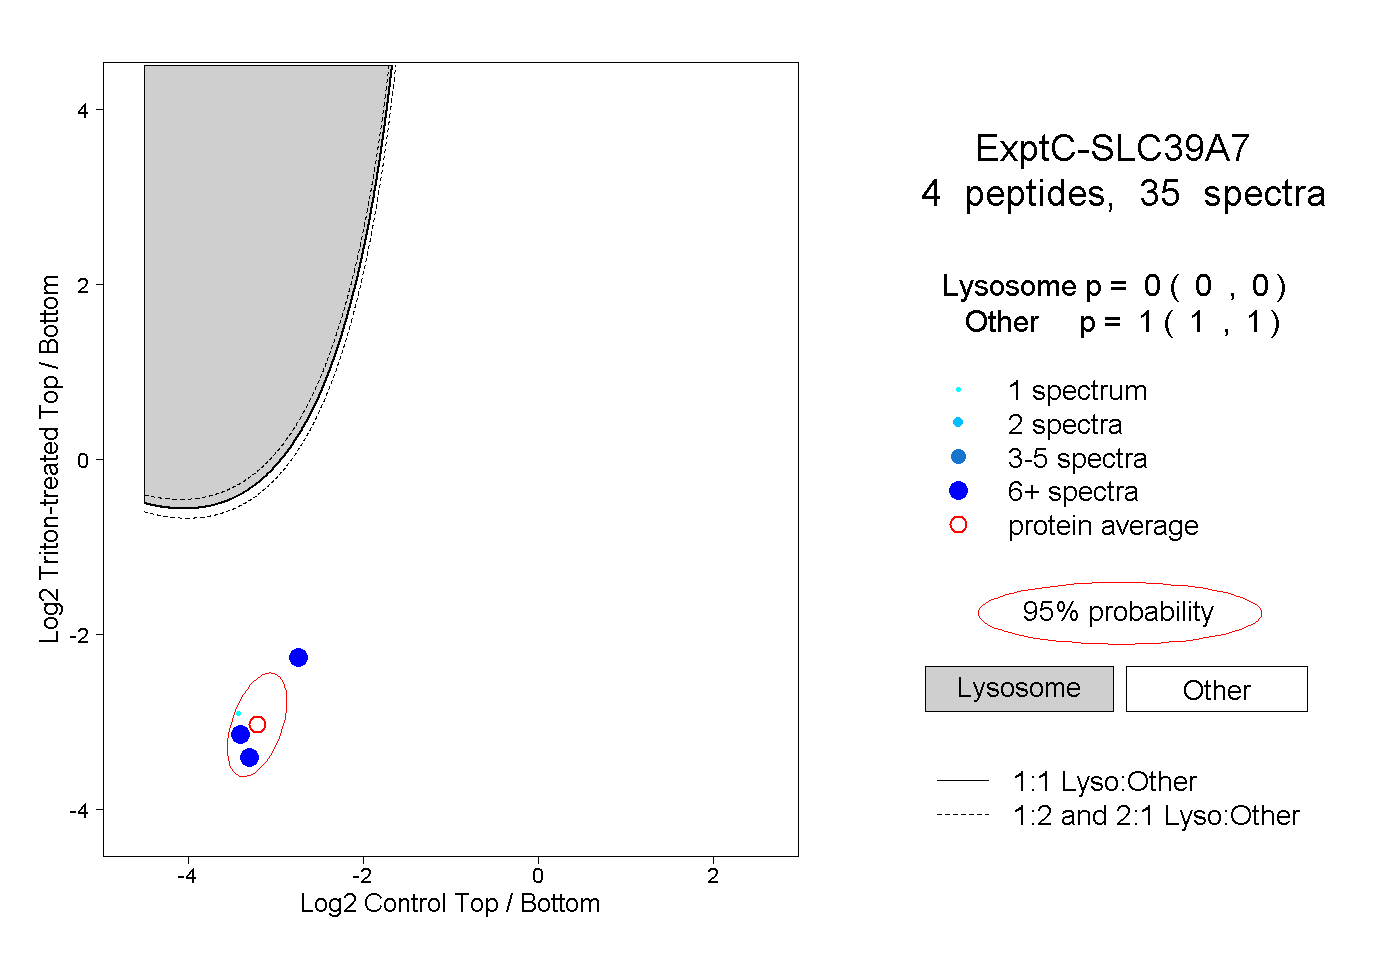
0.000 | 0.000
1.000 | 1.000
1peptide
spectra
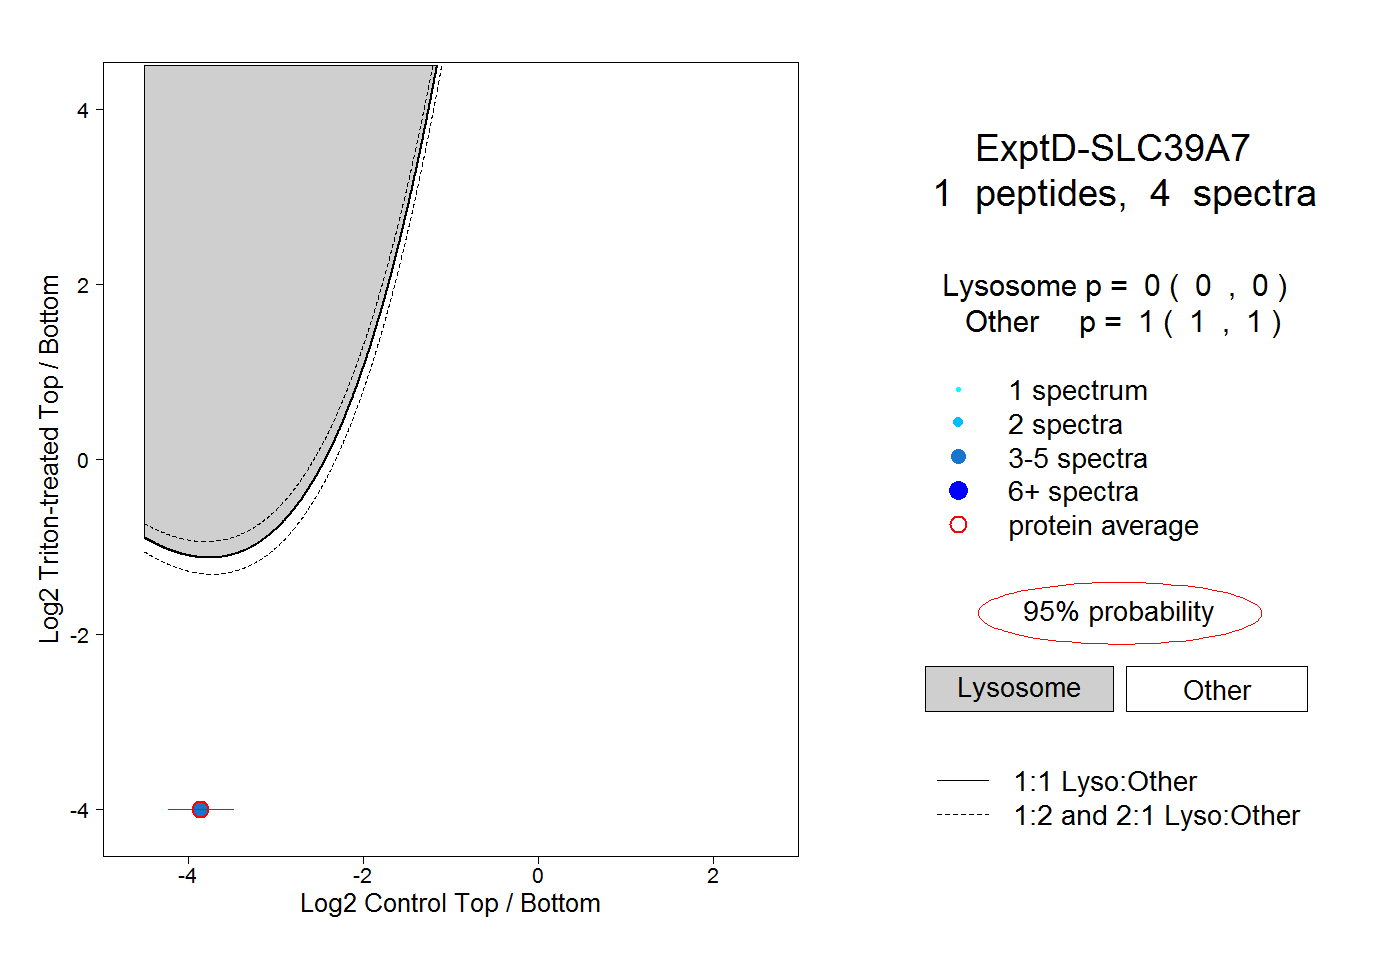
0.000 | 0.000
1.000 | 1.000