 1
1peptide
spectra
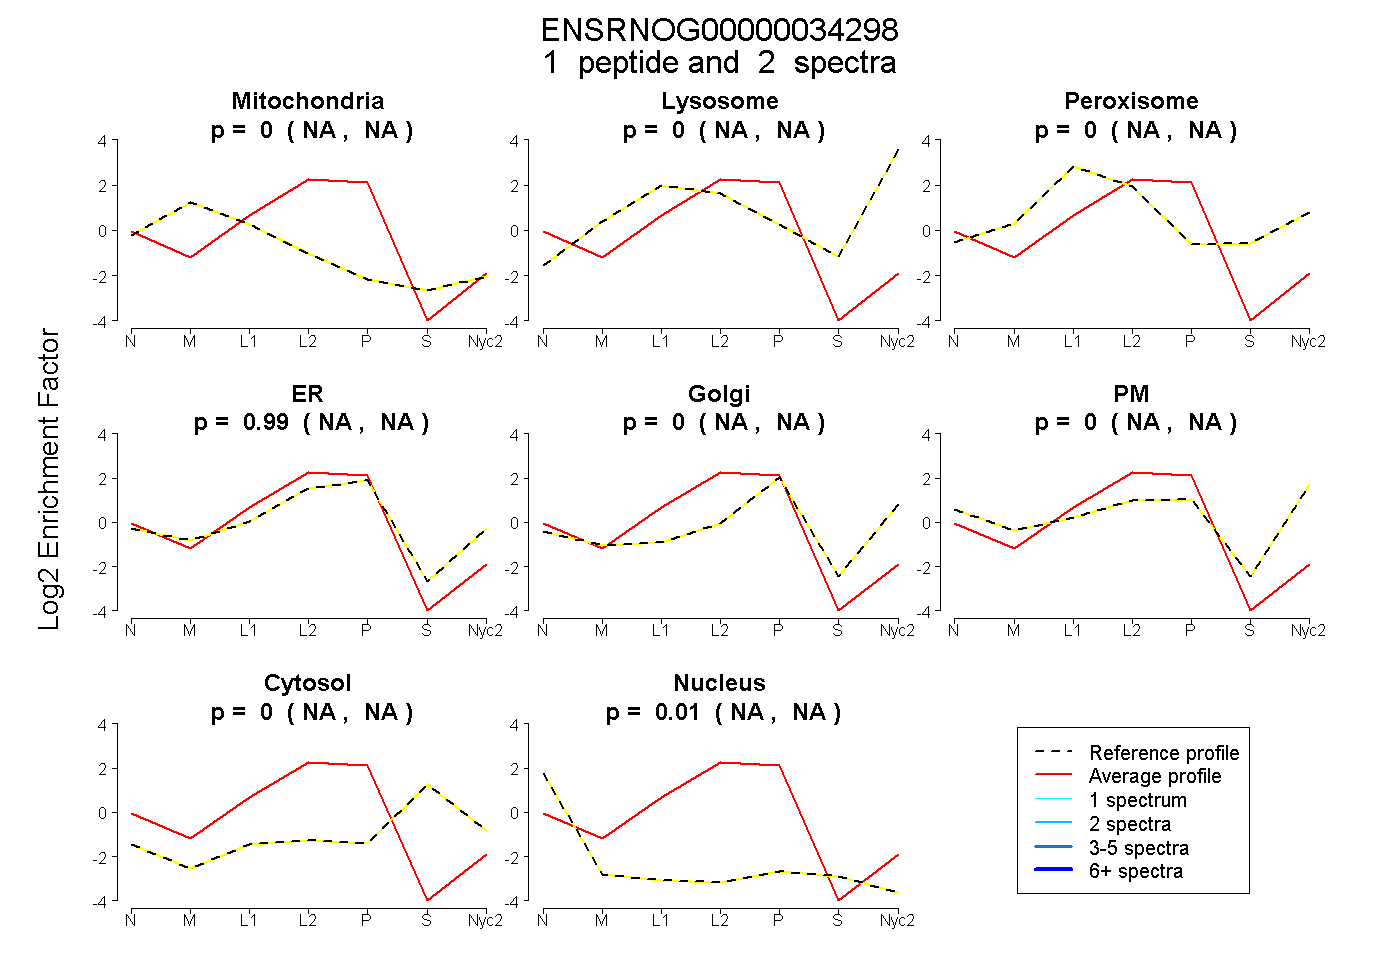
NA | NA
NA | NA
NA | NA
NA | NA
NA | NA
NA | NA
NA | NA
NA | NA
2peptides
spectra
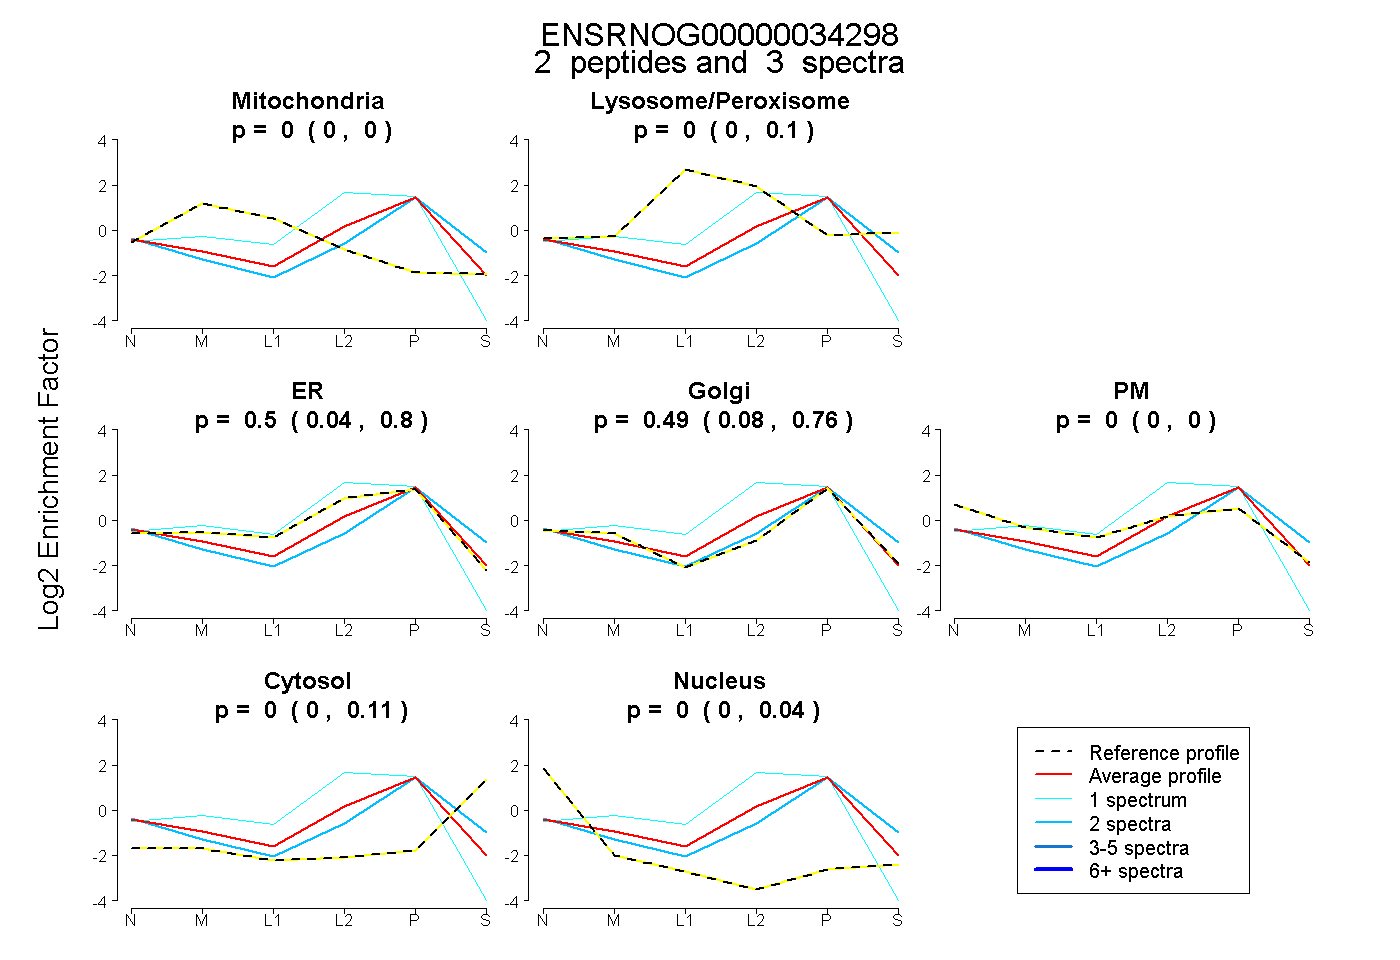
0.000 | 0.000
0.000 | 0.102
0.045 | 0.798
0.080 | 0.762
0.000 | 0.000
0.000 | 0.108
0.000 | 0.045
2peptides
spectra
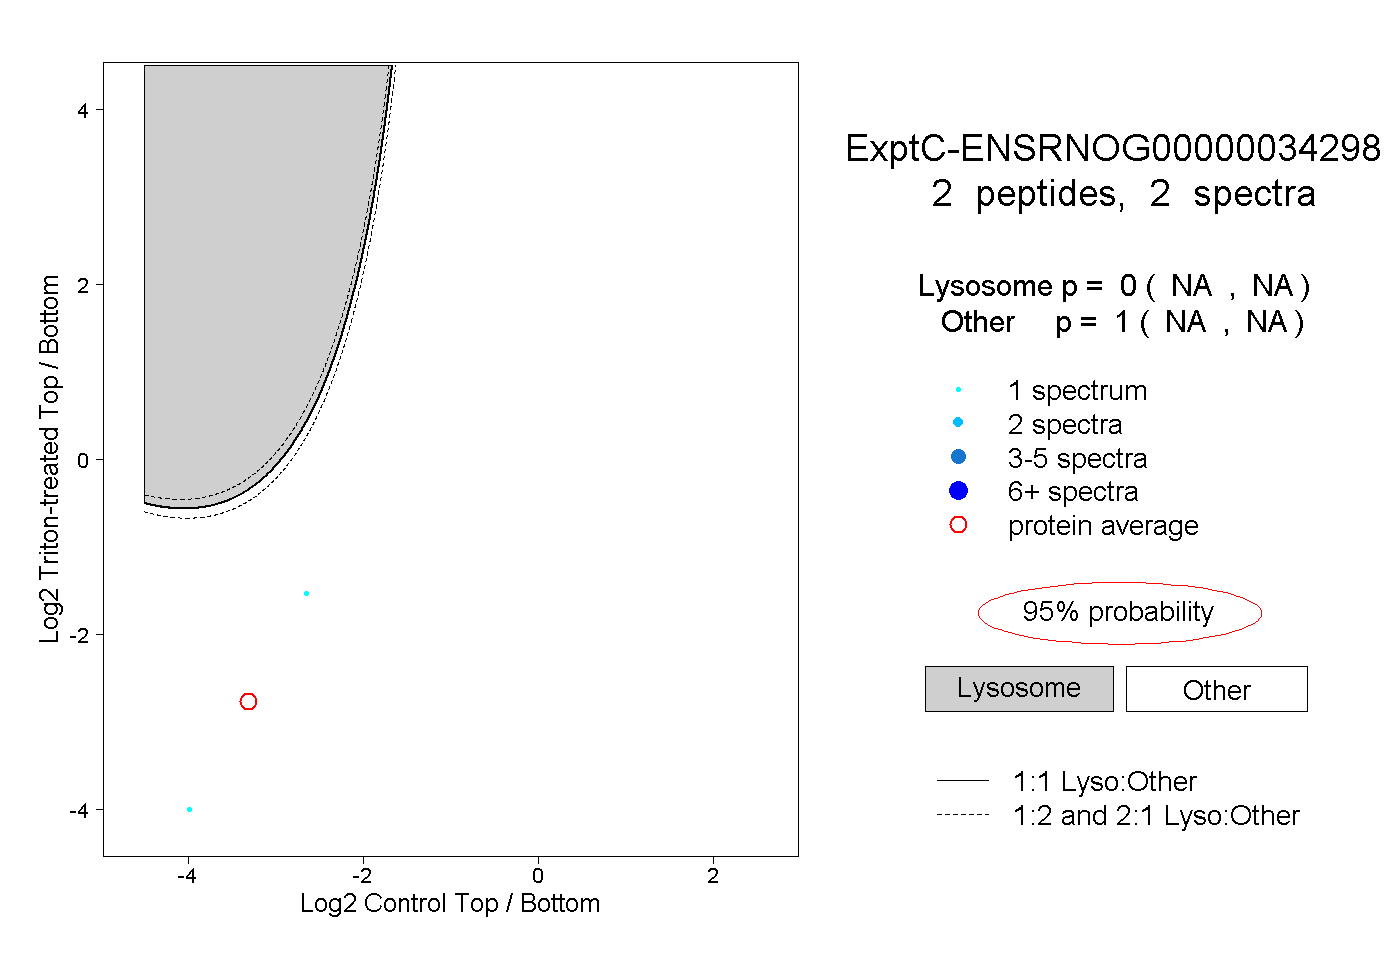
NA | NA
NA | NA
2peptides
spectra
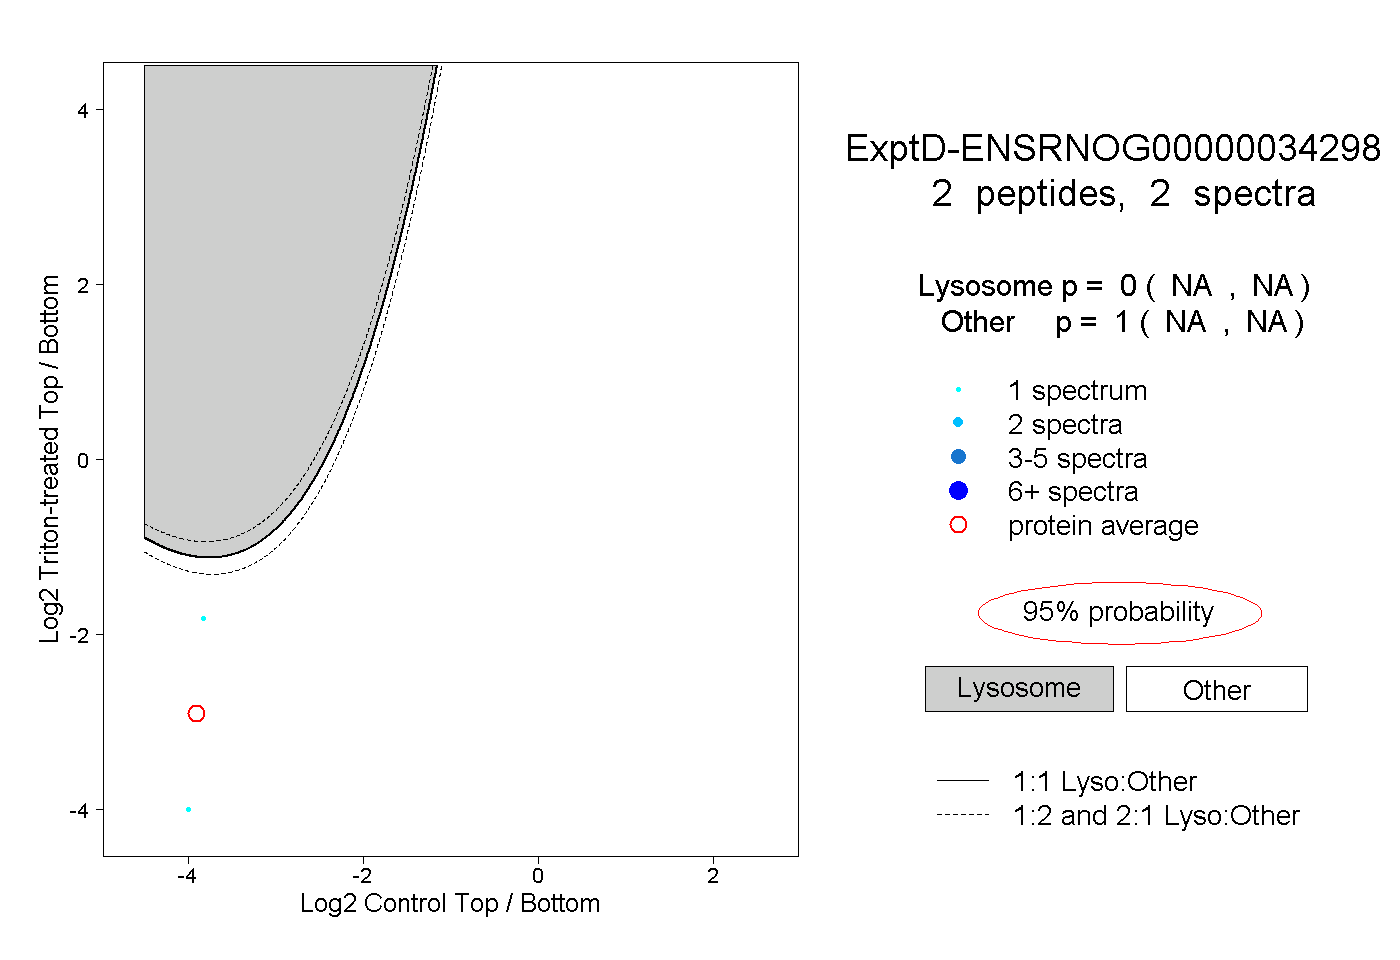
NA | NA
NA | NA