 19
19peptides
spectra
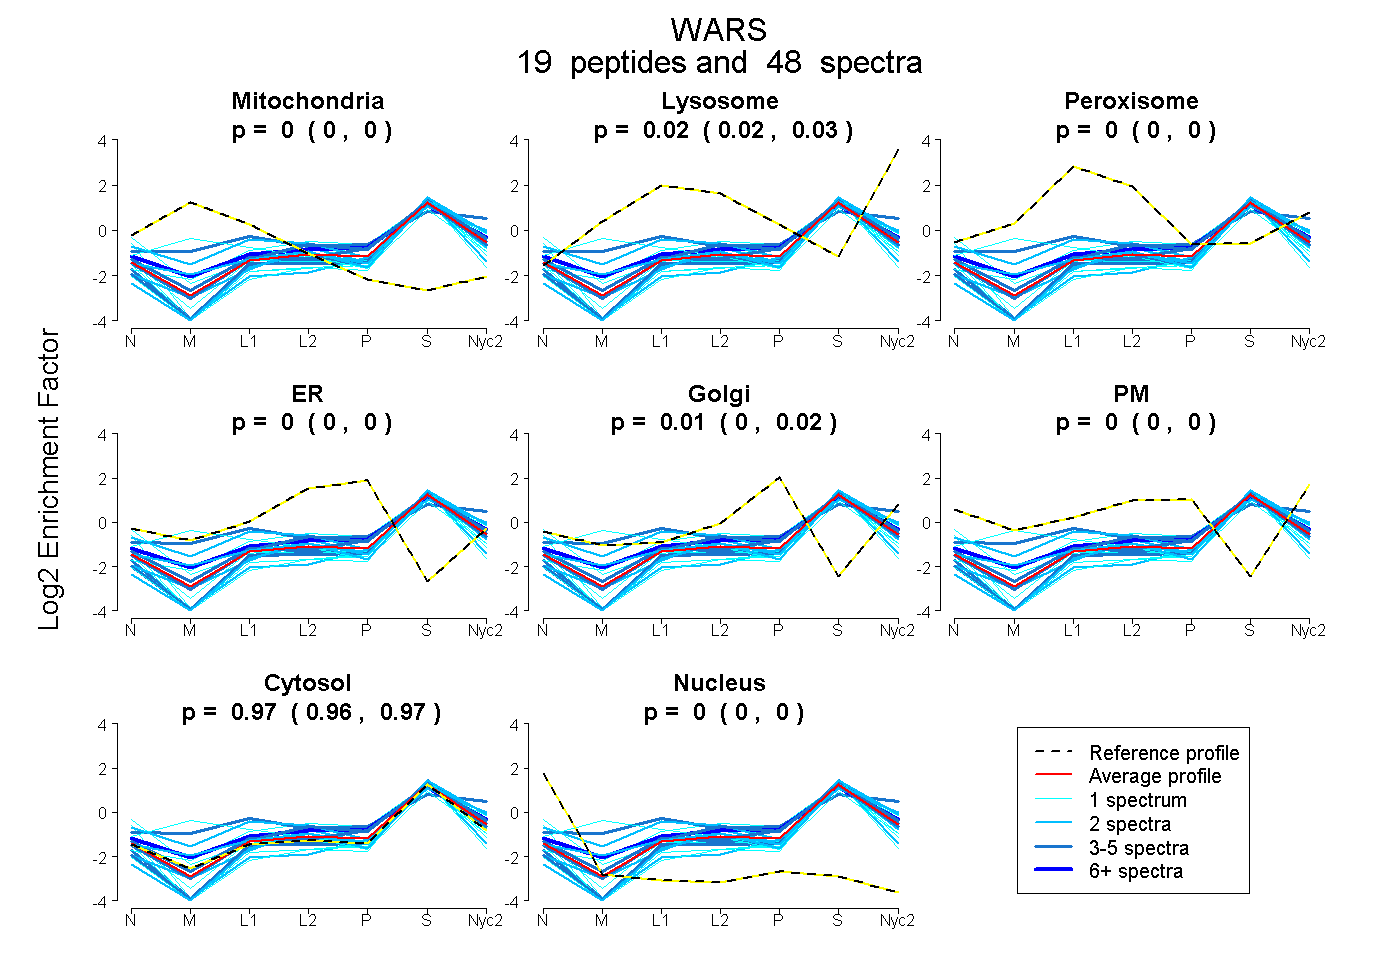
0.000 | 0.000
0.018 | 0.031
0.000 | 0.000
0.000 | 0.000
0.004 | 0.015
0.000 | 0.000
0.961 | 0.969
0.000 | 0.000
2peptides
spectra
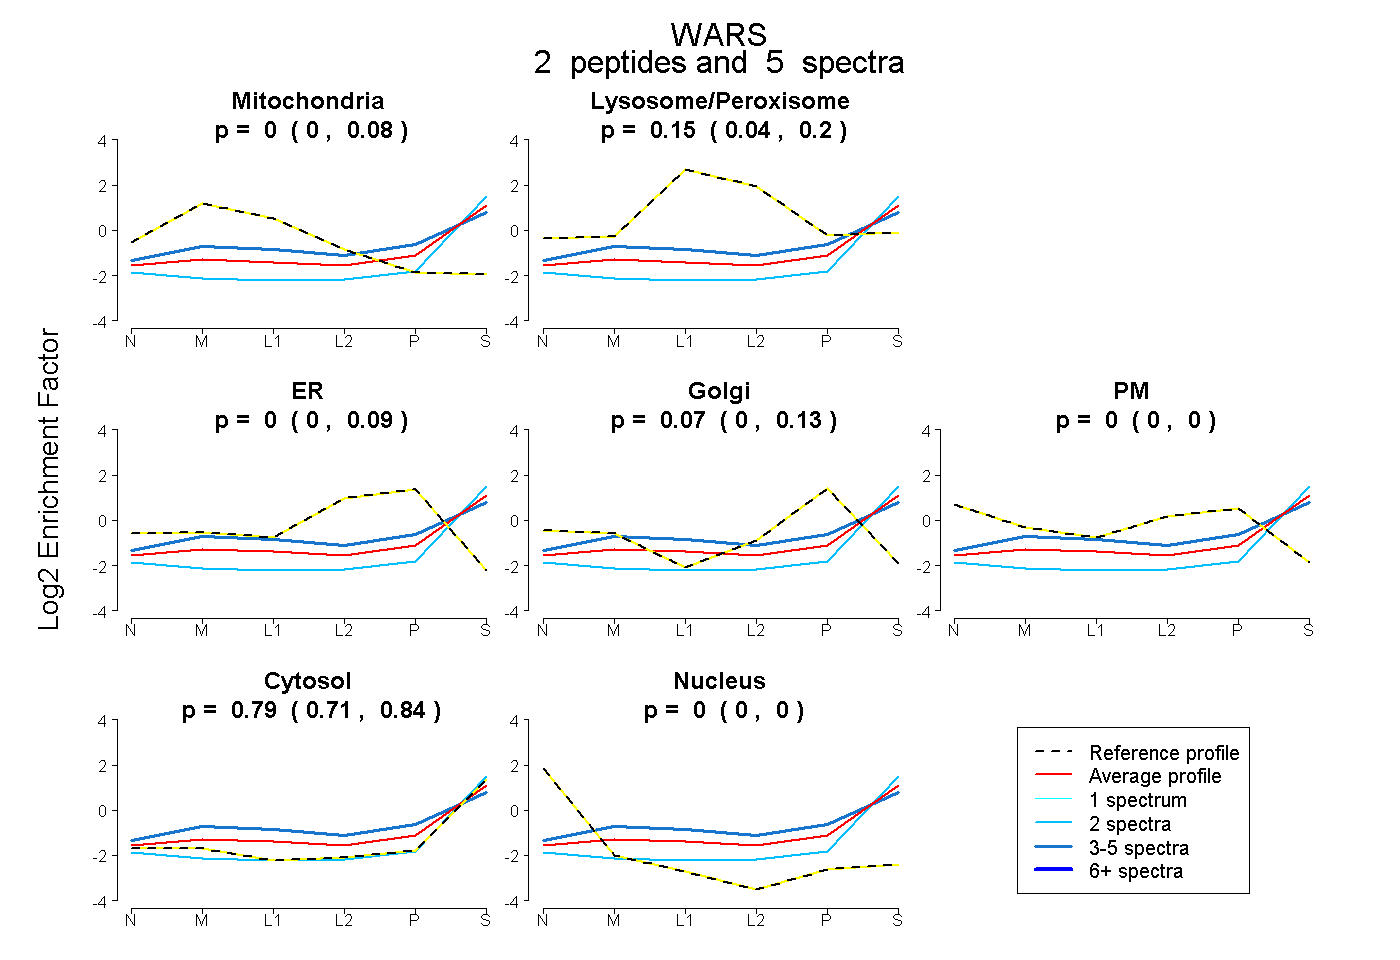
0.000 | 0.082
0.042 | 0.204
0.000 | 0.089
0.000 | 0.133
0.000 | 0.000
0.708 | 0.845
0.000 | 0.000
13peptides
spectra
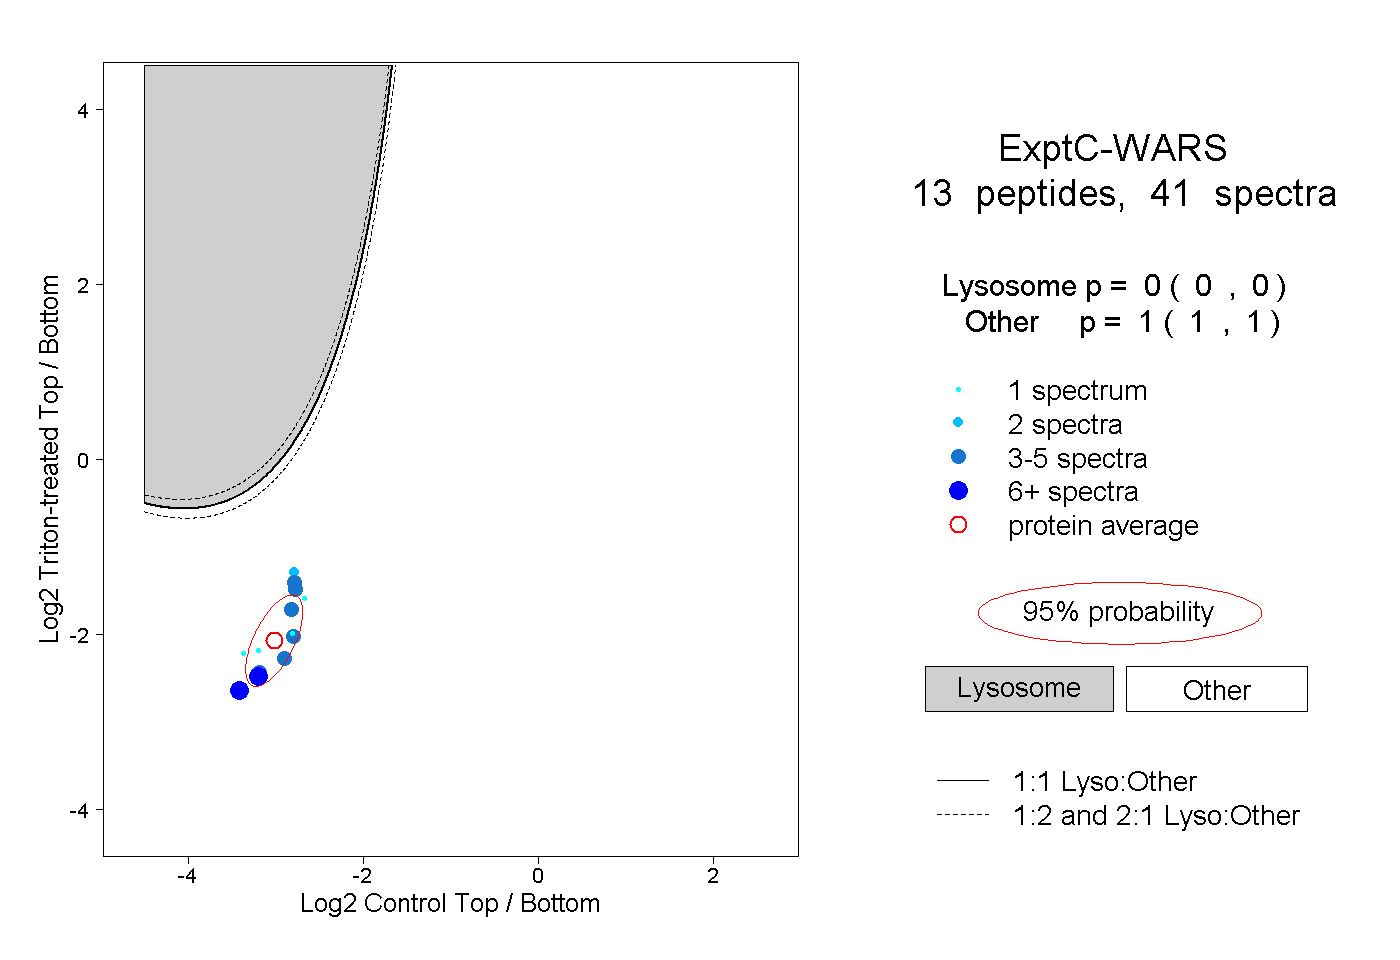
0.000 | 0.000
1.000 | 1.000
2peptides
spectra
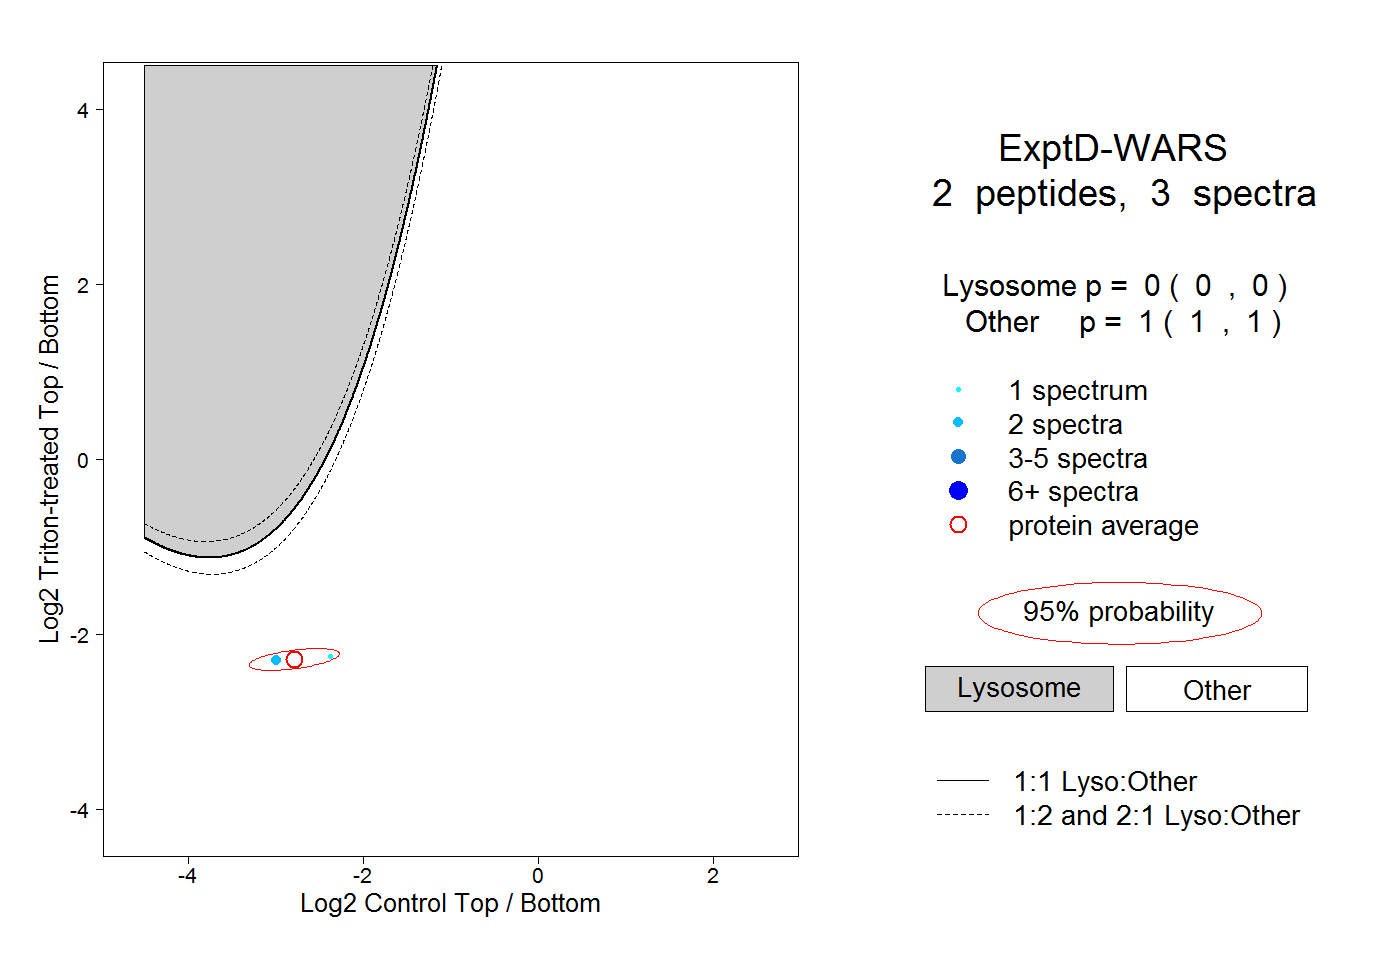
0.000 | 0.000
1.000 | 1.000