 2
2peptides
spectra
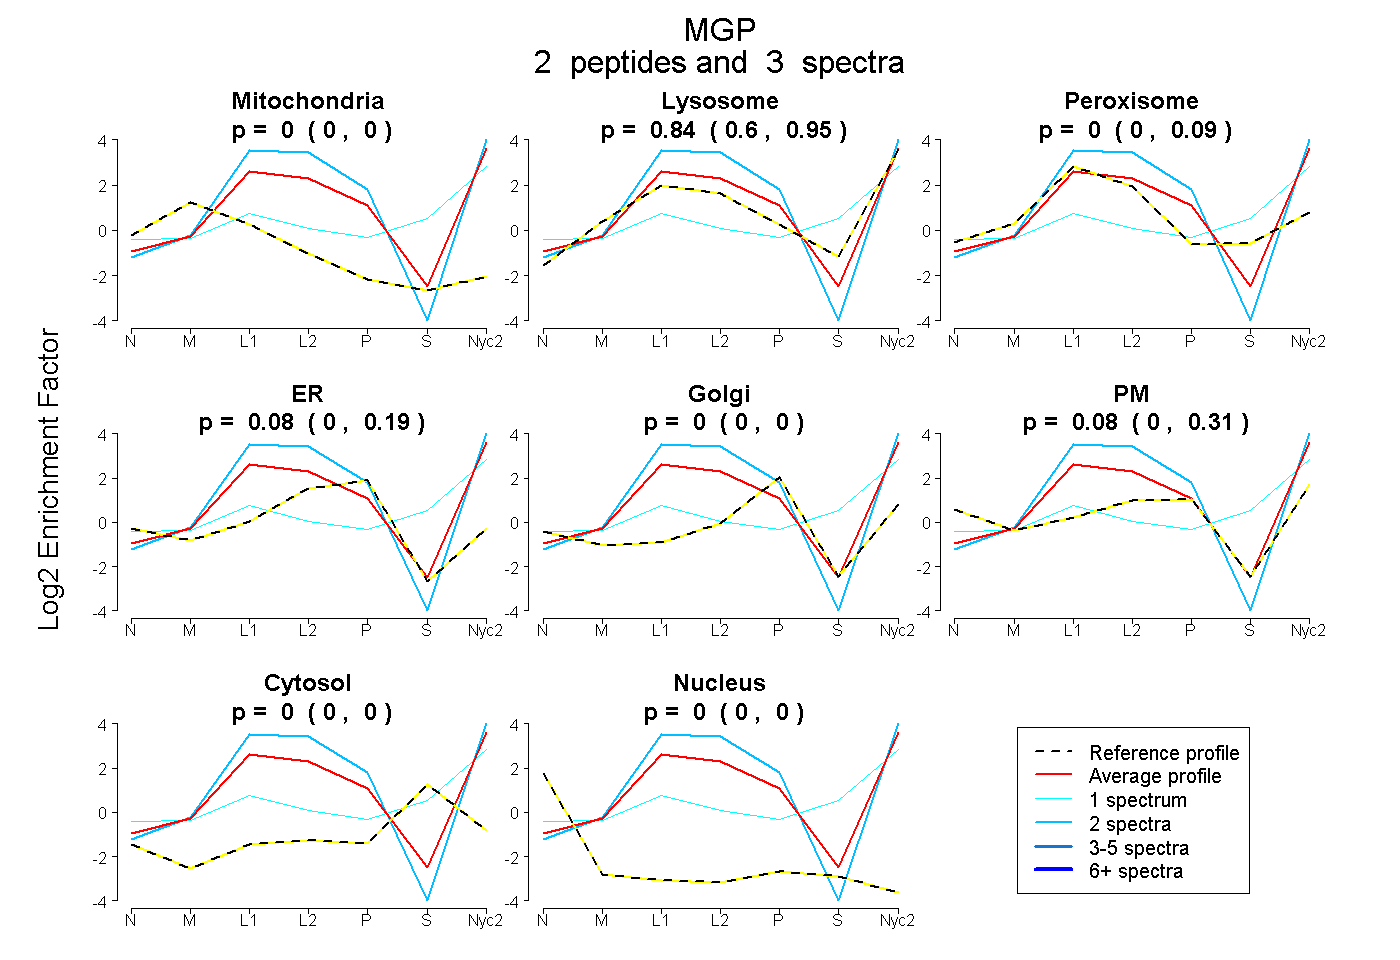
0.000 | 0.000
0.602 | 0.948
0.000 | 0.091
0.000 | 0.193
0.000 | 0.000
0.000 | 0.310
0.000 | 0.000
0.000 | 0.000
1peptide
spectra
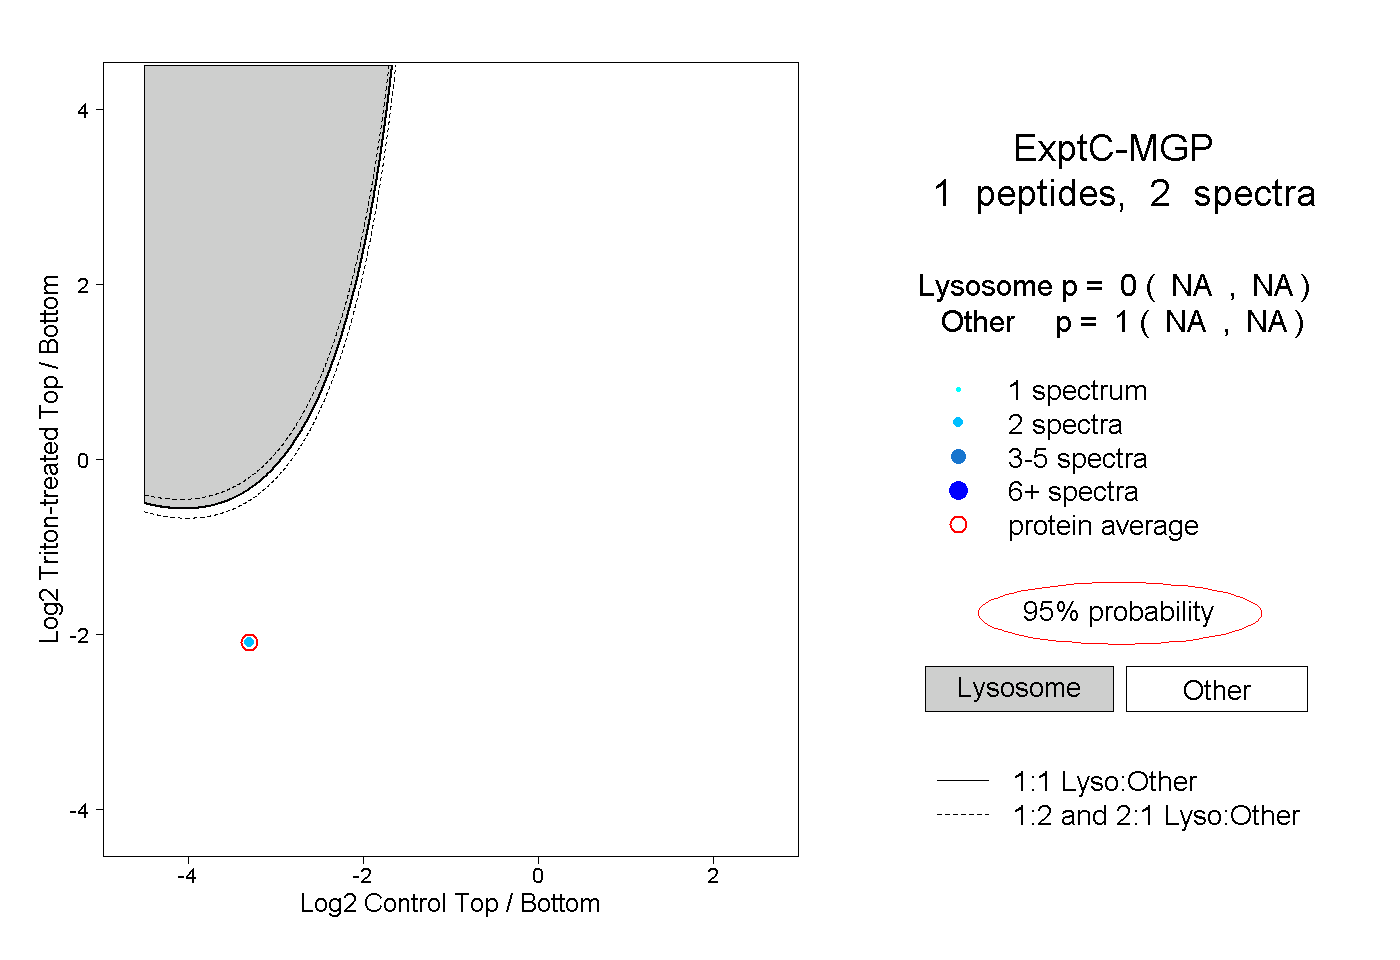
NA | NA
NA | NA
1peptide
spectrum
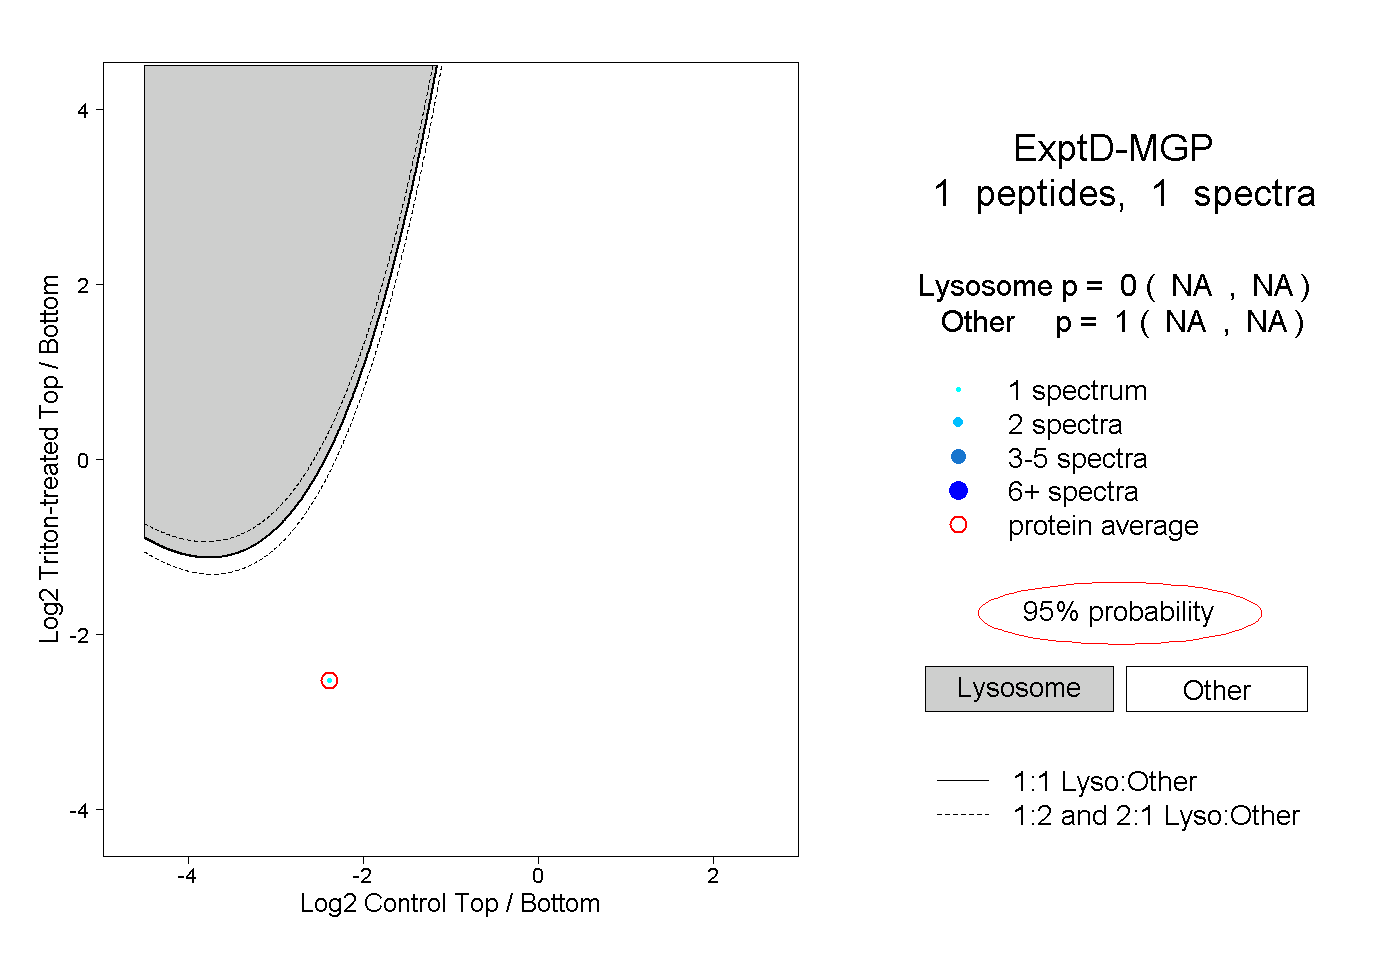
NA | NA
NA | NA