 28
28peptides
spectra
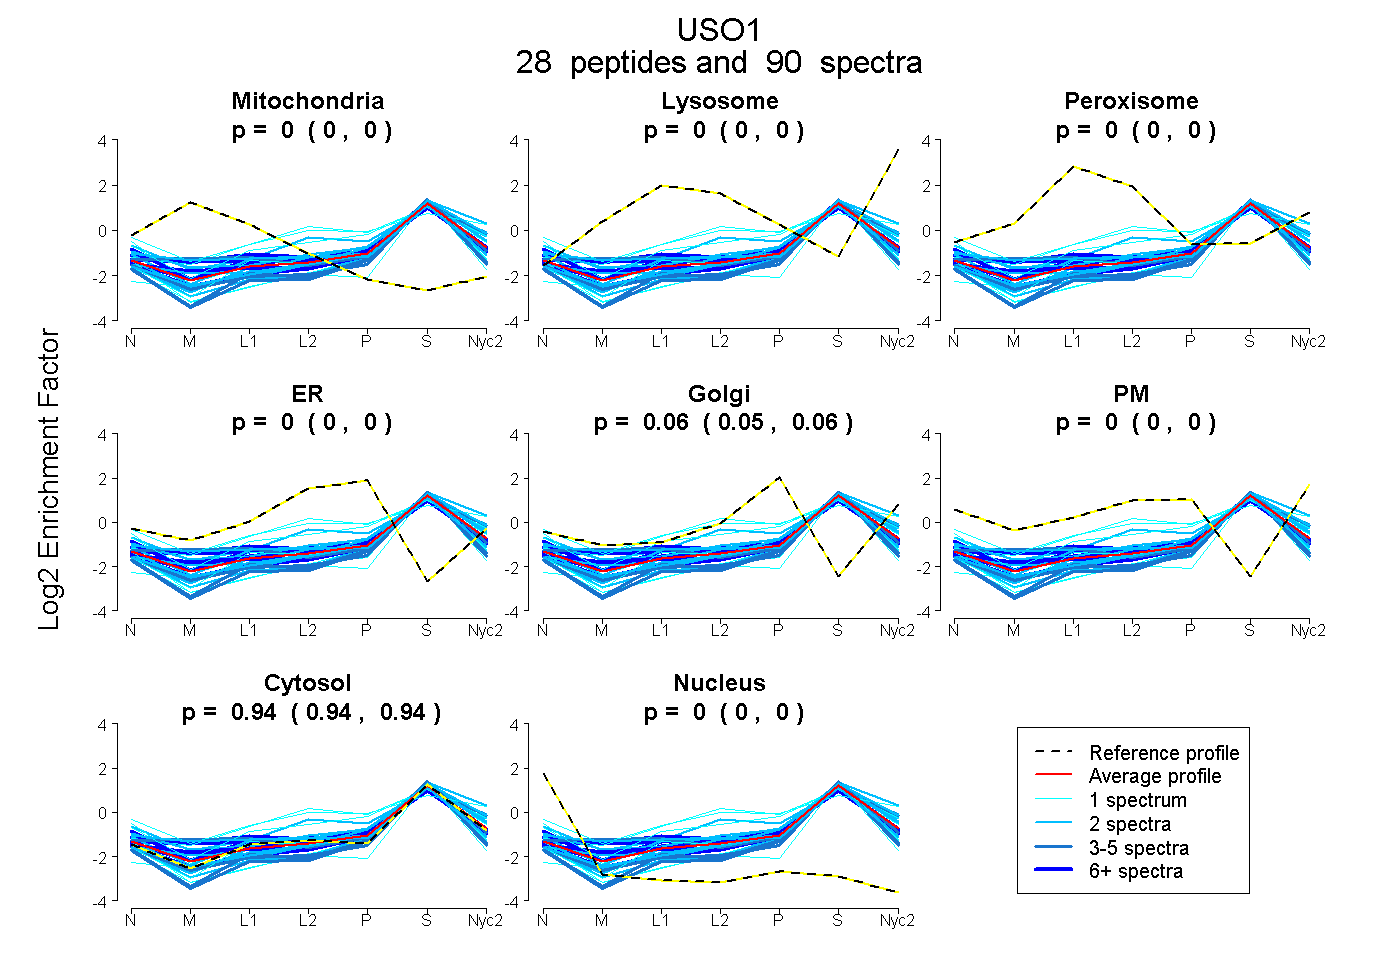
0.000 | 0.000
0.000 | 0.000
0.000 | 0.000
0.000 | 0.000
0.055 | 0.059
0.000 | 0.000
0.940 | 0.944
0.000 | 0.001
12peptides
spectra
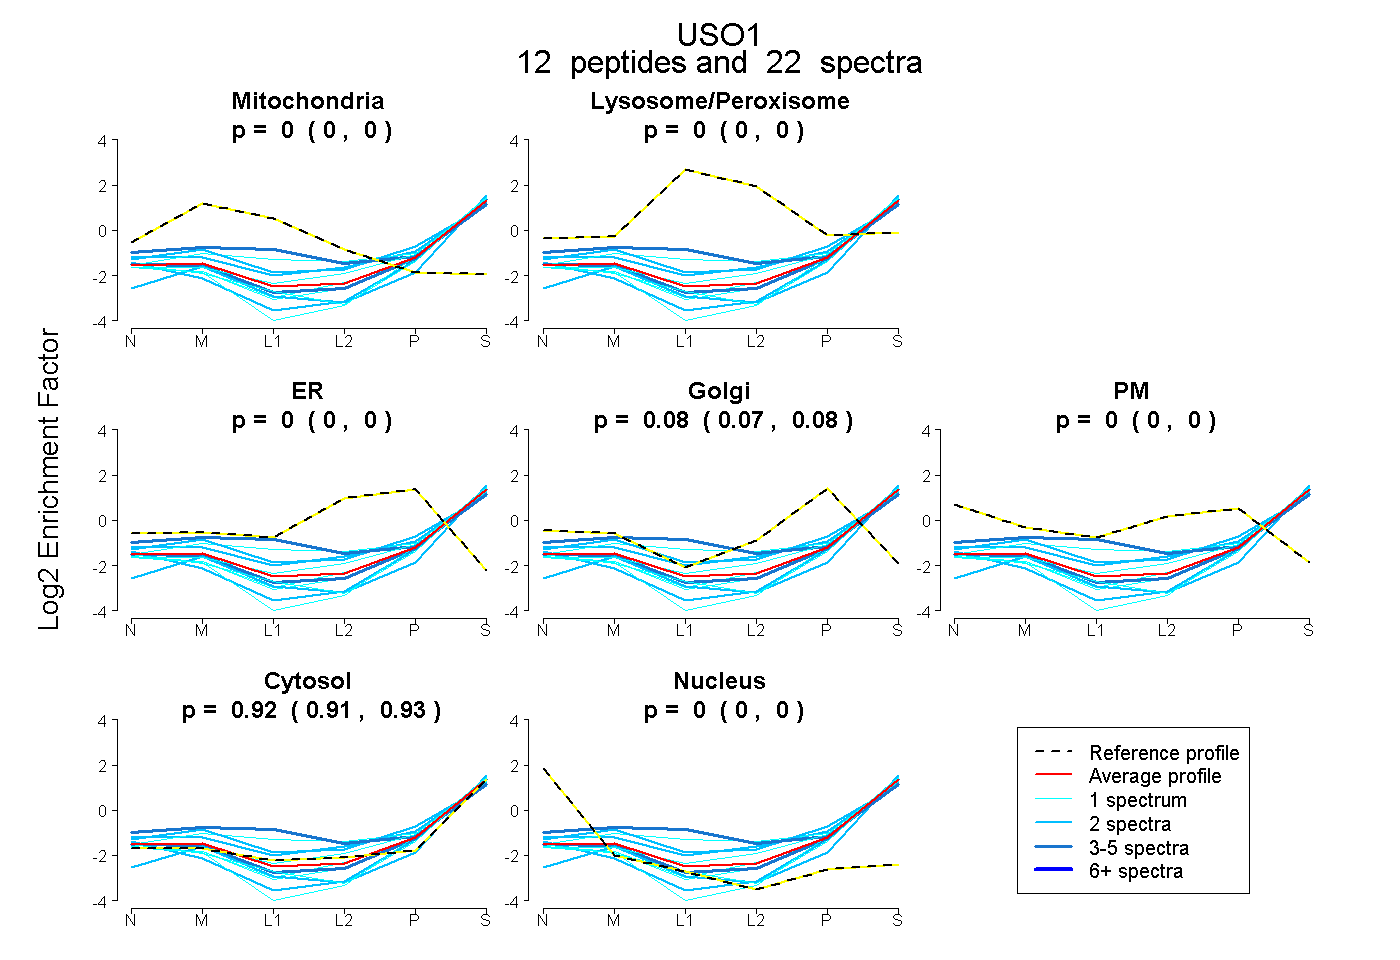
0.000 | 0.000
0.000 | 0.000
0.000 | 0.000
0.071 | 0.085
0.000 | 0.000
0.914 | 0.927
0.000 | 0.000
19peptides
spectra
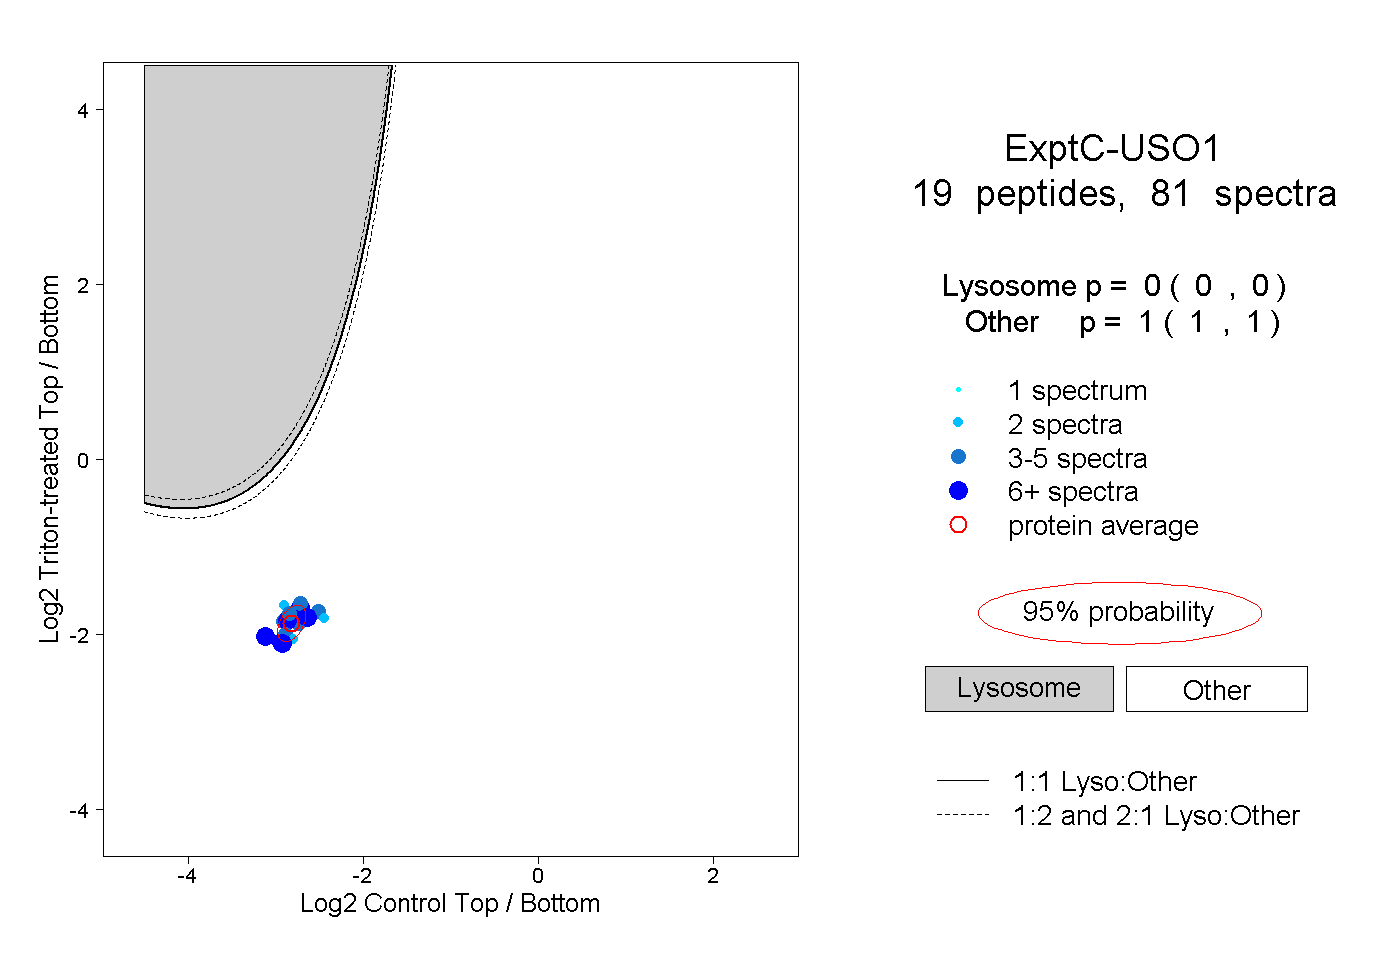
0.000 | 0.000
1.000 | 1.000
5peptides
spectra
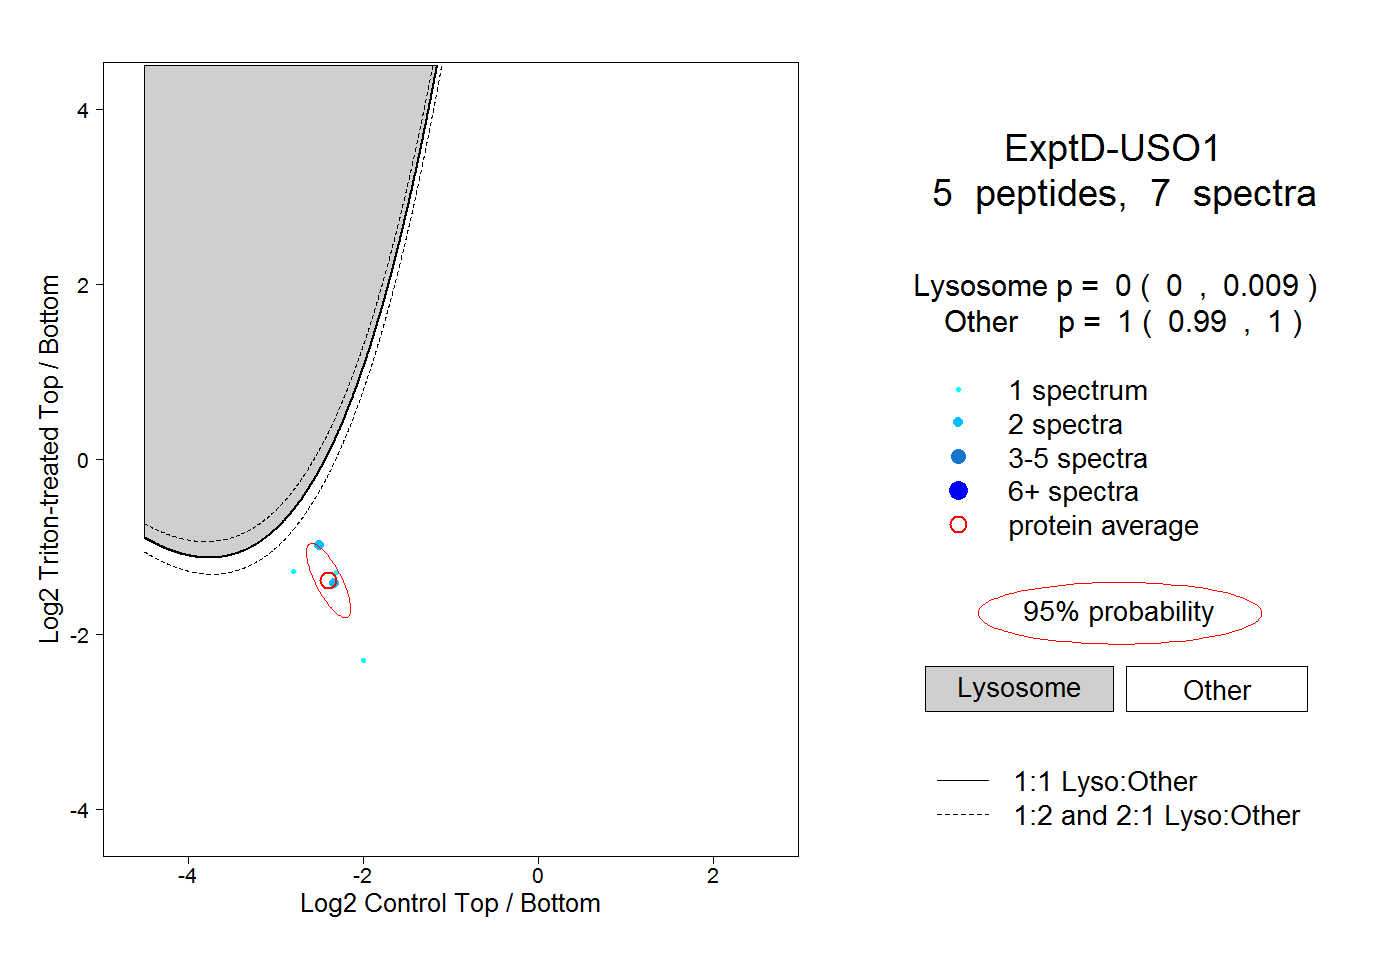
0.000 | 0.009
0.990 | 1.000