 4
4peptides
spectra
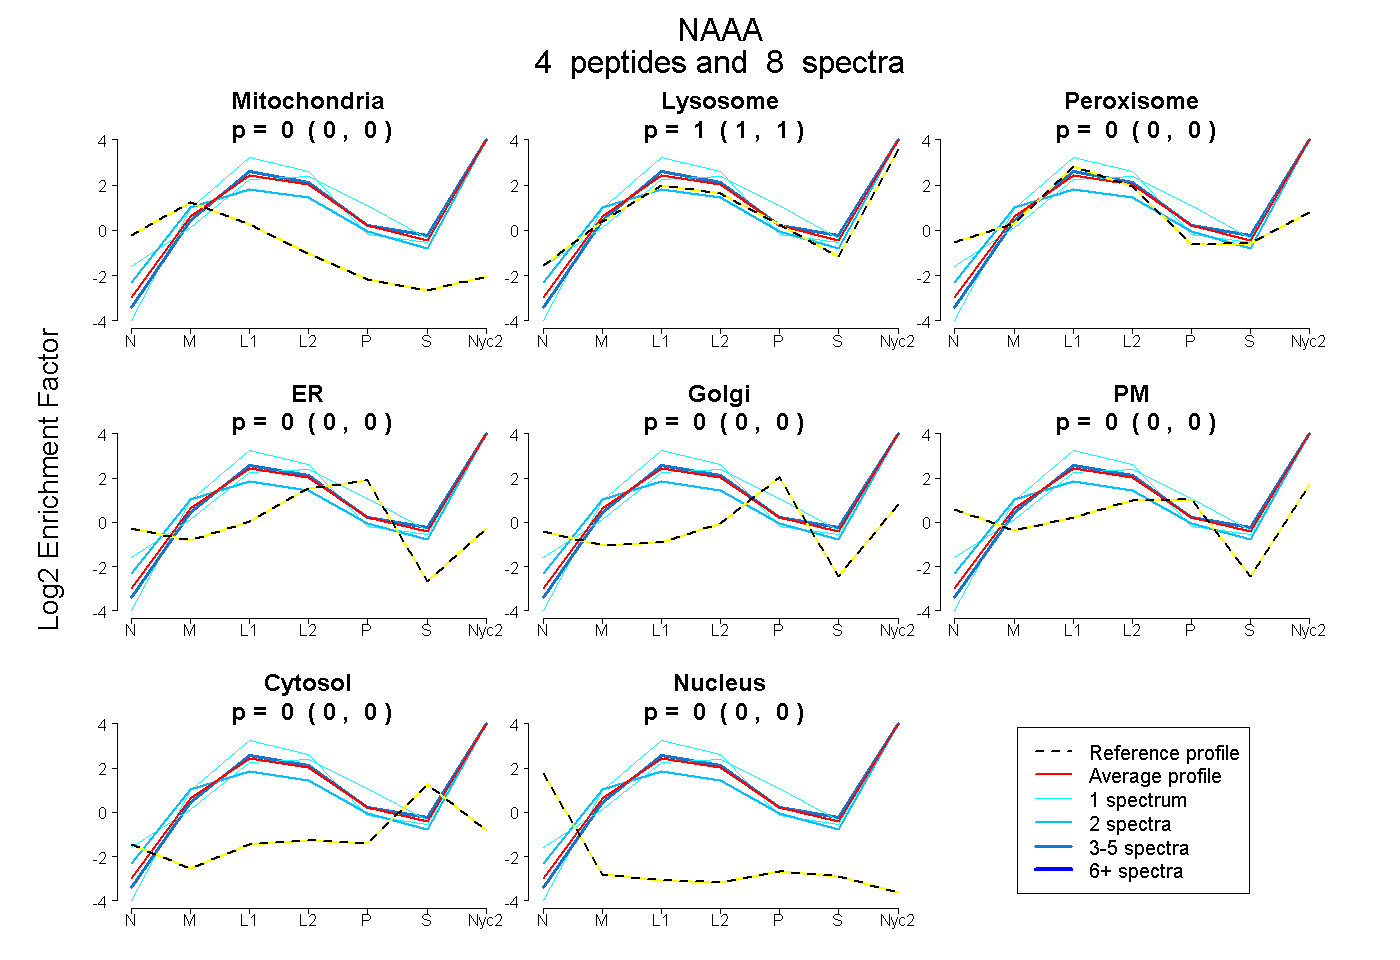
0.000 | 0.000
1.000 | 1.000
0.000 | 0.000
0.000 | 0.000
0.000 | 0.000
0.000 | 0.000
0.000 | 0.000
0.000 | 0.000
2peptides
spectra
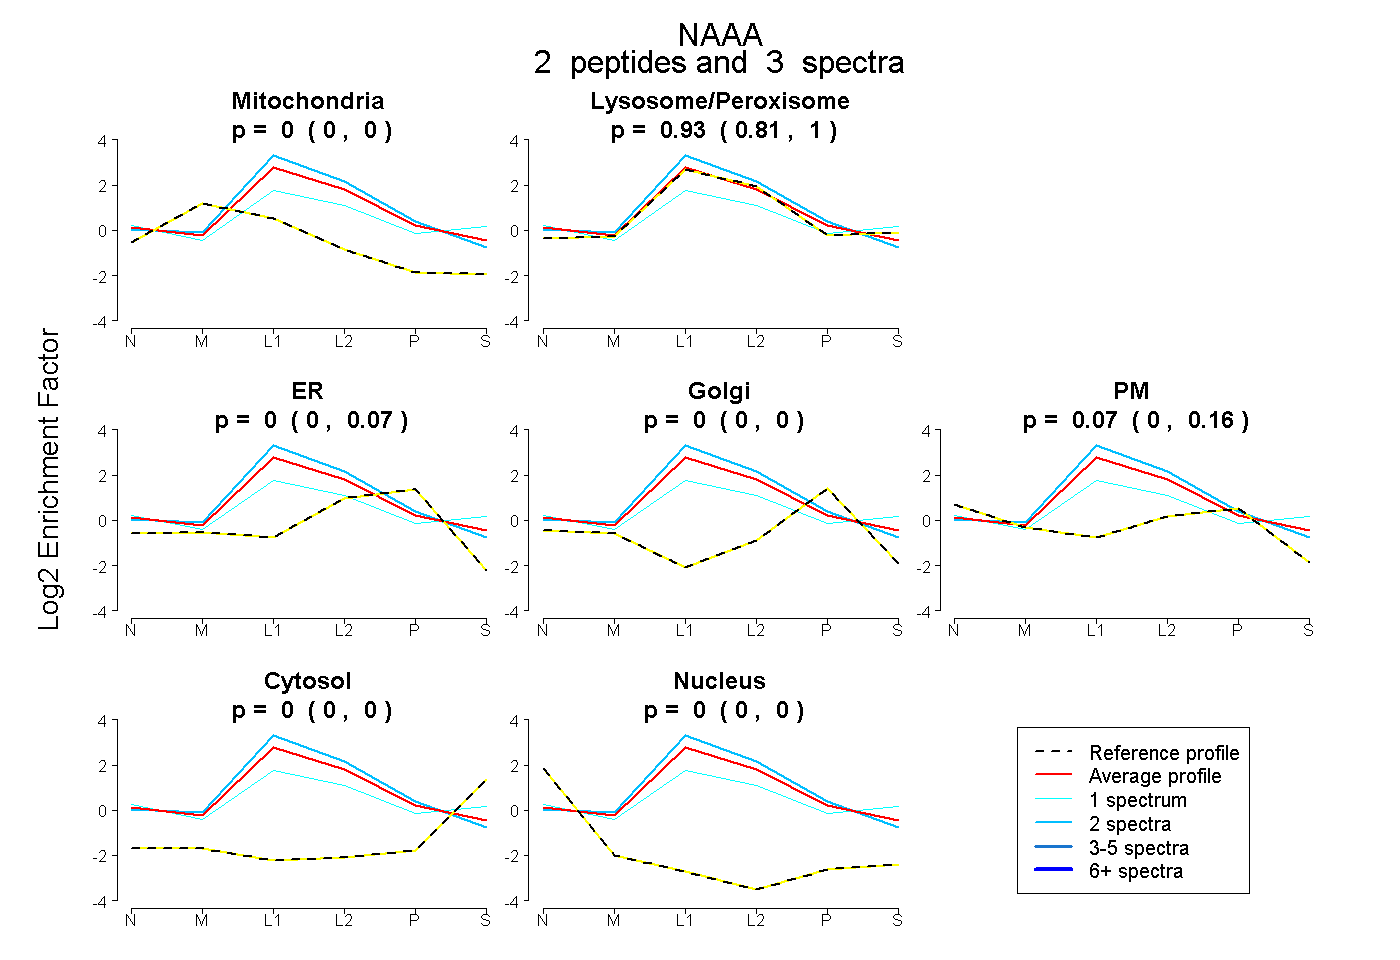
0.000 | 0.000
0.812 | 1.000
0.000 | 0.066
0.000 | 0.000
0.000 | 0.156
0.000 | 0.000
0.000 | 0.000
6peptides
spectra
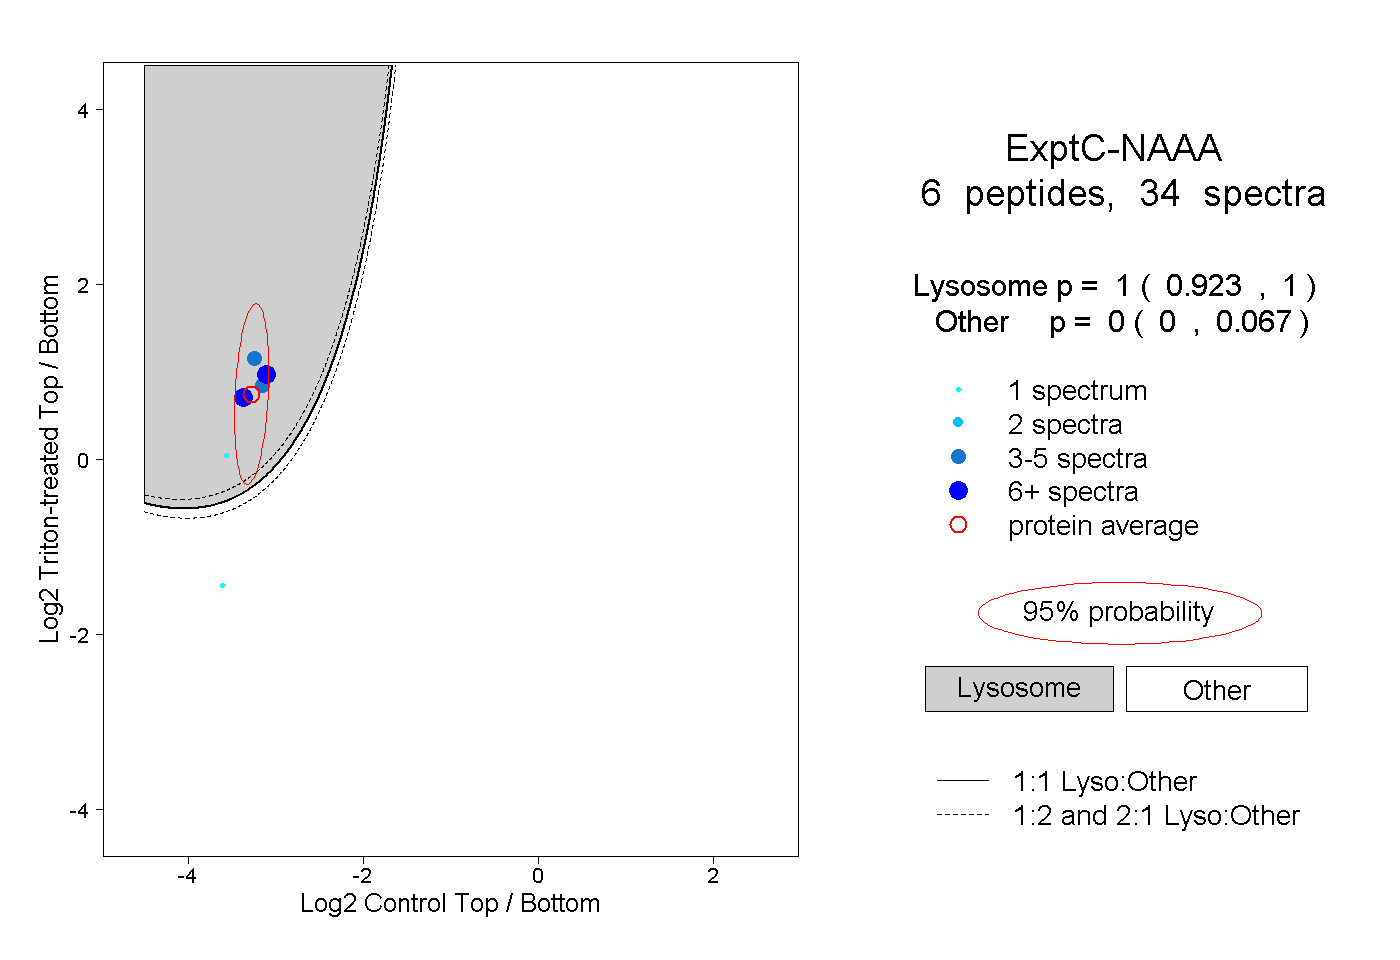
0.923 | 1.000
0.000 | 0.067
3peptides
spectra
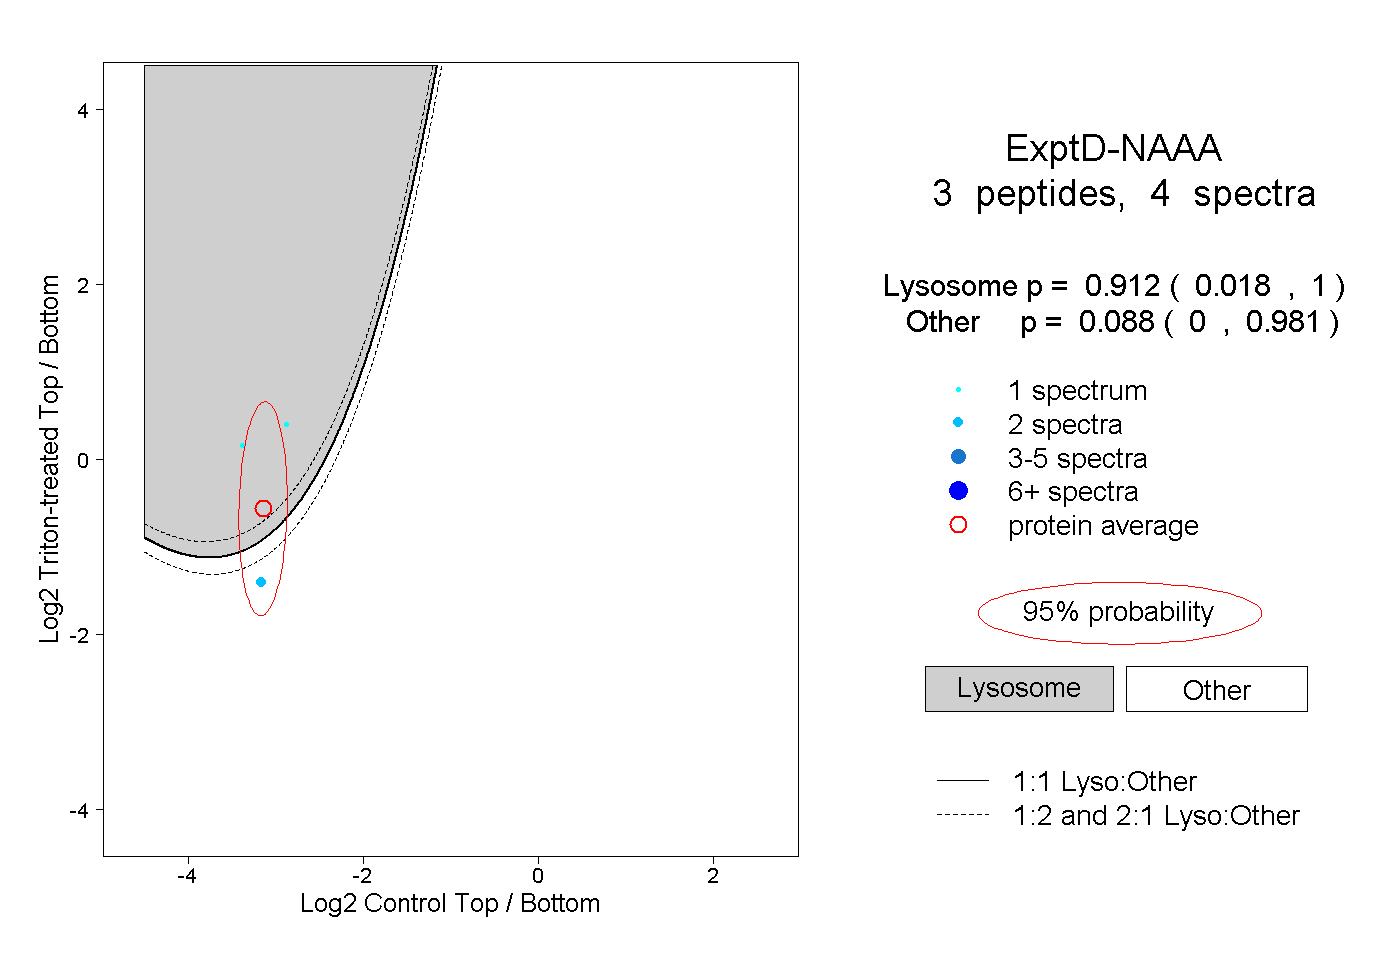
0.018 | 1.000
0.000 | 0.981