 6
6peptides
spectra
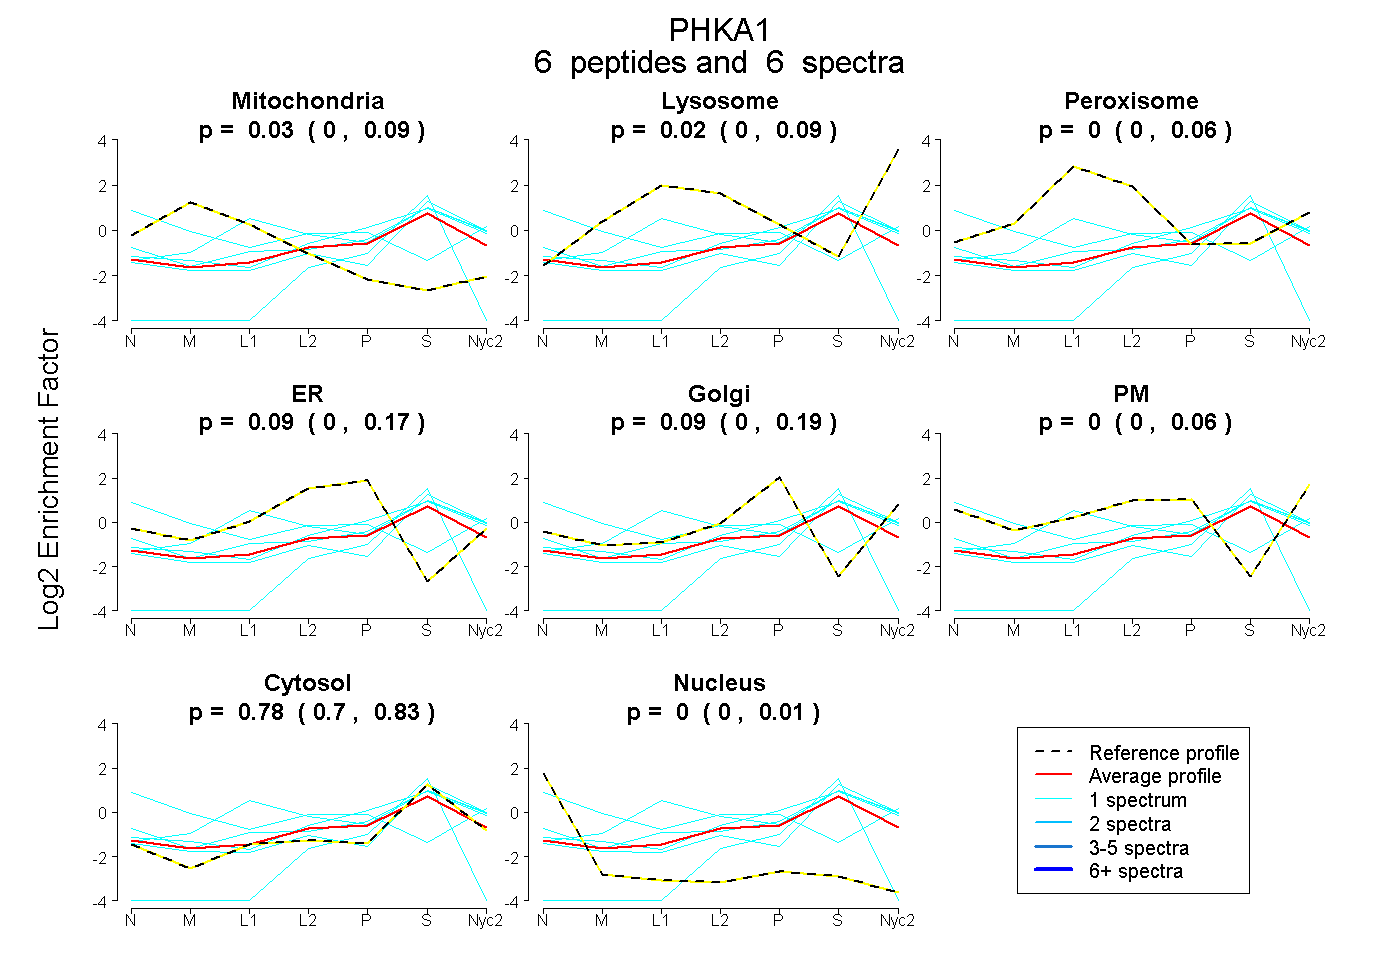
0.000 | 0.090
0.000 | 0.090
0.000 | 0.059
0.000 | 0.174
0.000 | 0.193
0.000 | 0.063
0.698 | 0.828
0.000 | 0.007
1peptide
spectrum
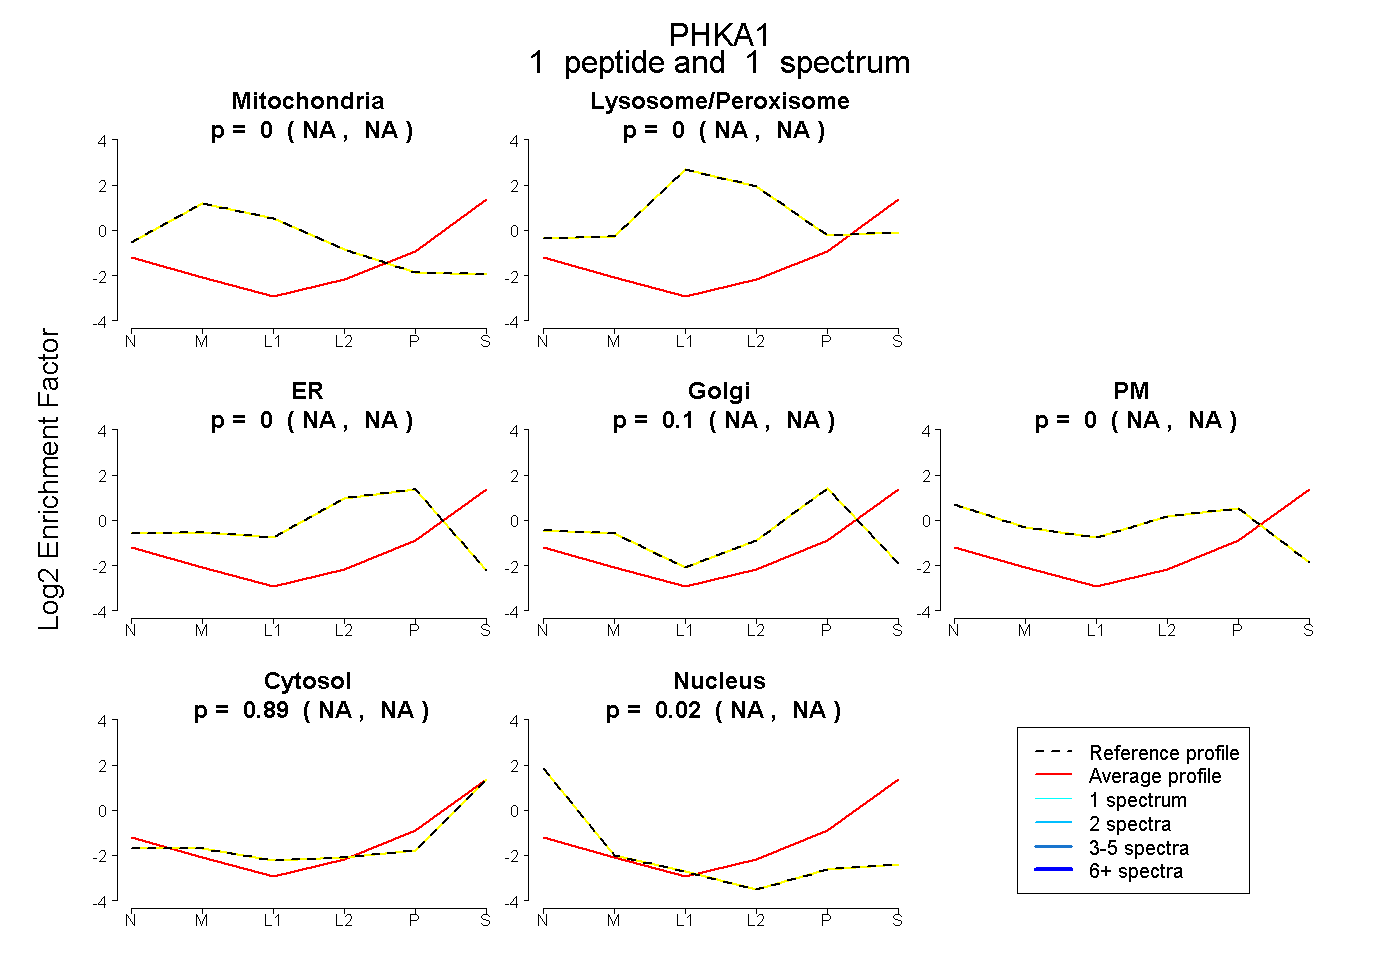
NA | NA
NA | NA
NA | NA
NA | NA
NA | NA
NA | NA
NA | NA
4peptides
spectra
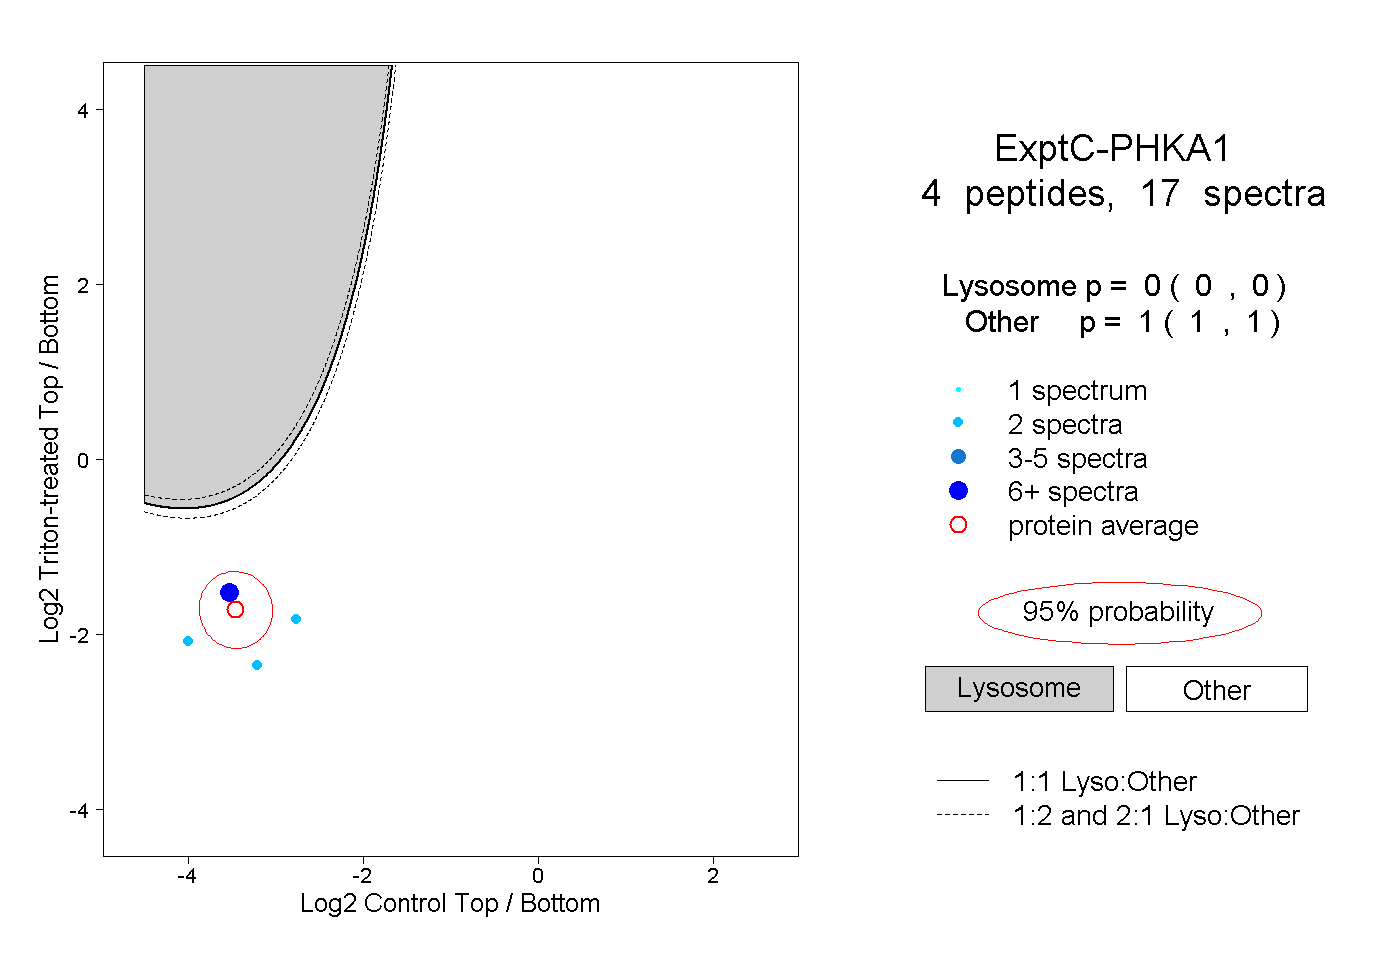
0.000 | 0.000
1.000 | 1.000