 5
5peptides
spectra
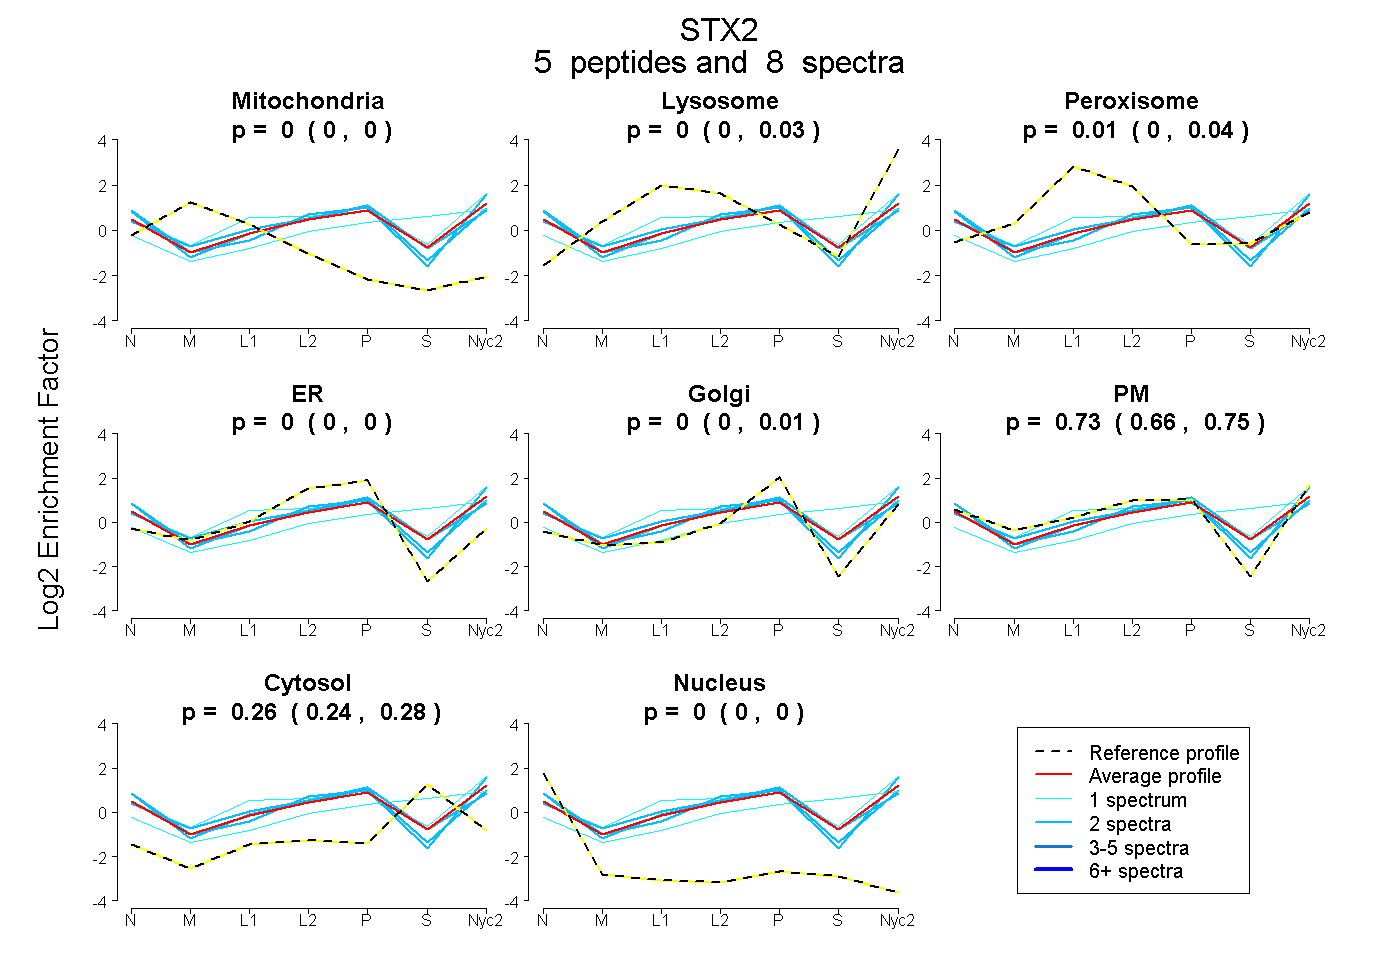
0.000 | 0.000
0.000 | 0.035
0.000 | 0.041
0.000 | 0.000
0.000 | 0.011
0.664 | 0.752
0.236 | 0.284
0.000 | 0.000
1peptide
spectrum
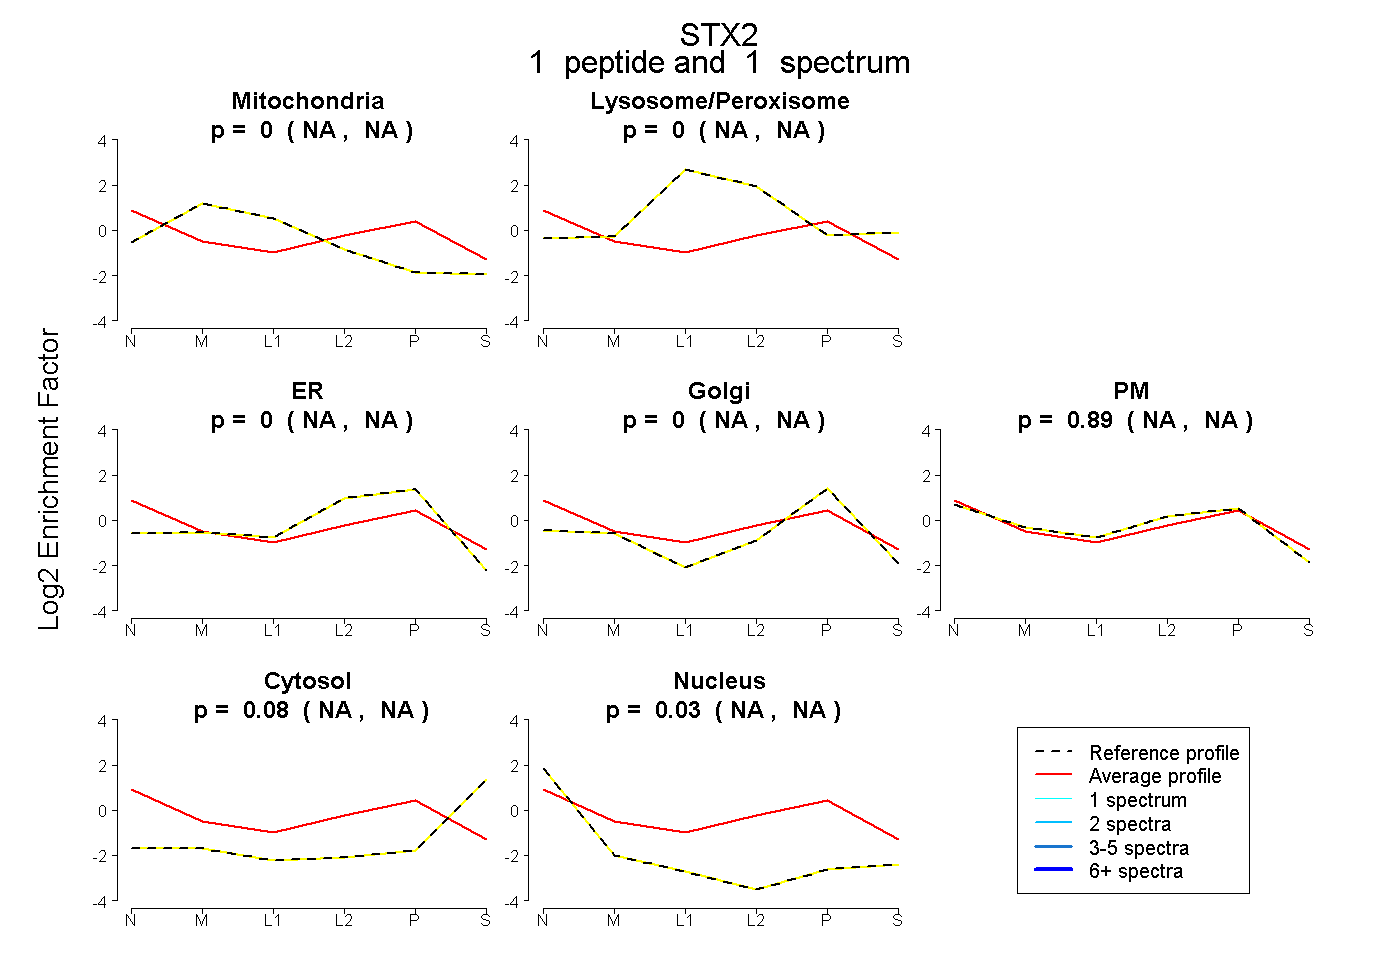
NA | NA
NA | NA
NA | NA
NA | NA
NA | NA
NA | NA
NA | NA
4peptides
spectra
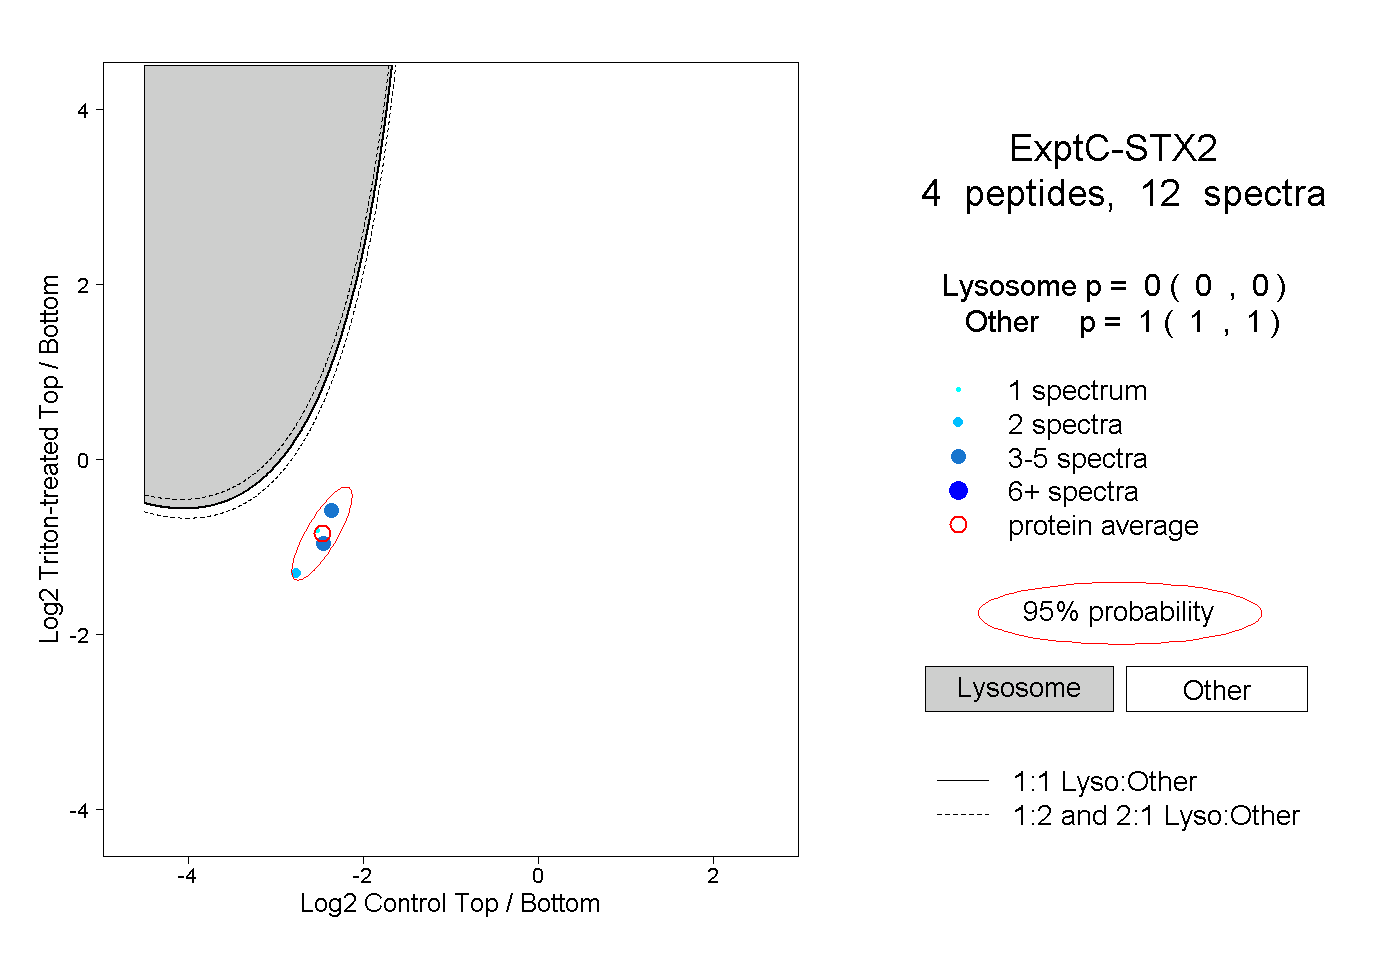
0.000 | 0.000
1.000 | 1.000
1peptide
spectra
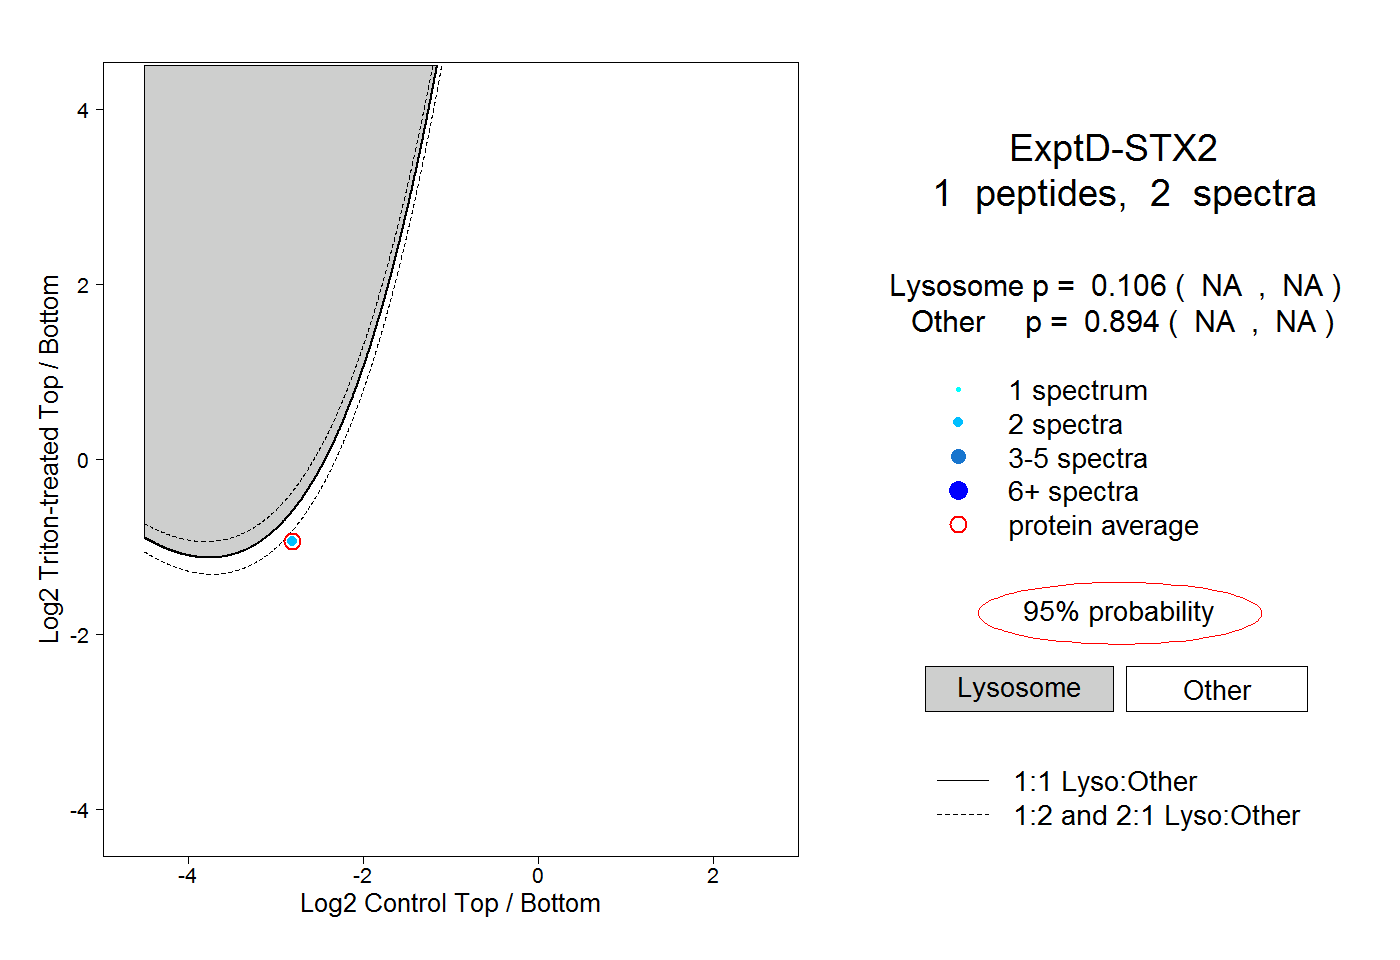
NA | NA
NA | NA