 4
4peptides
spectra
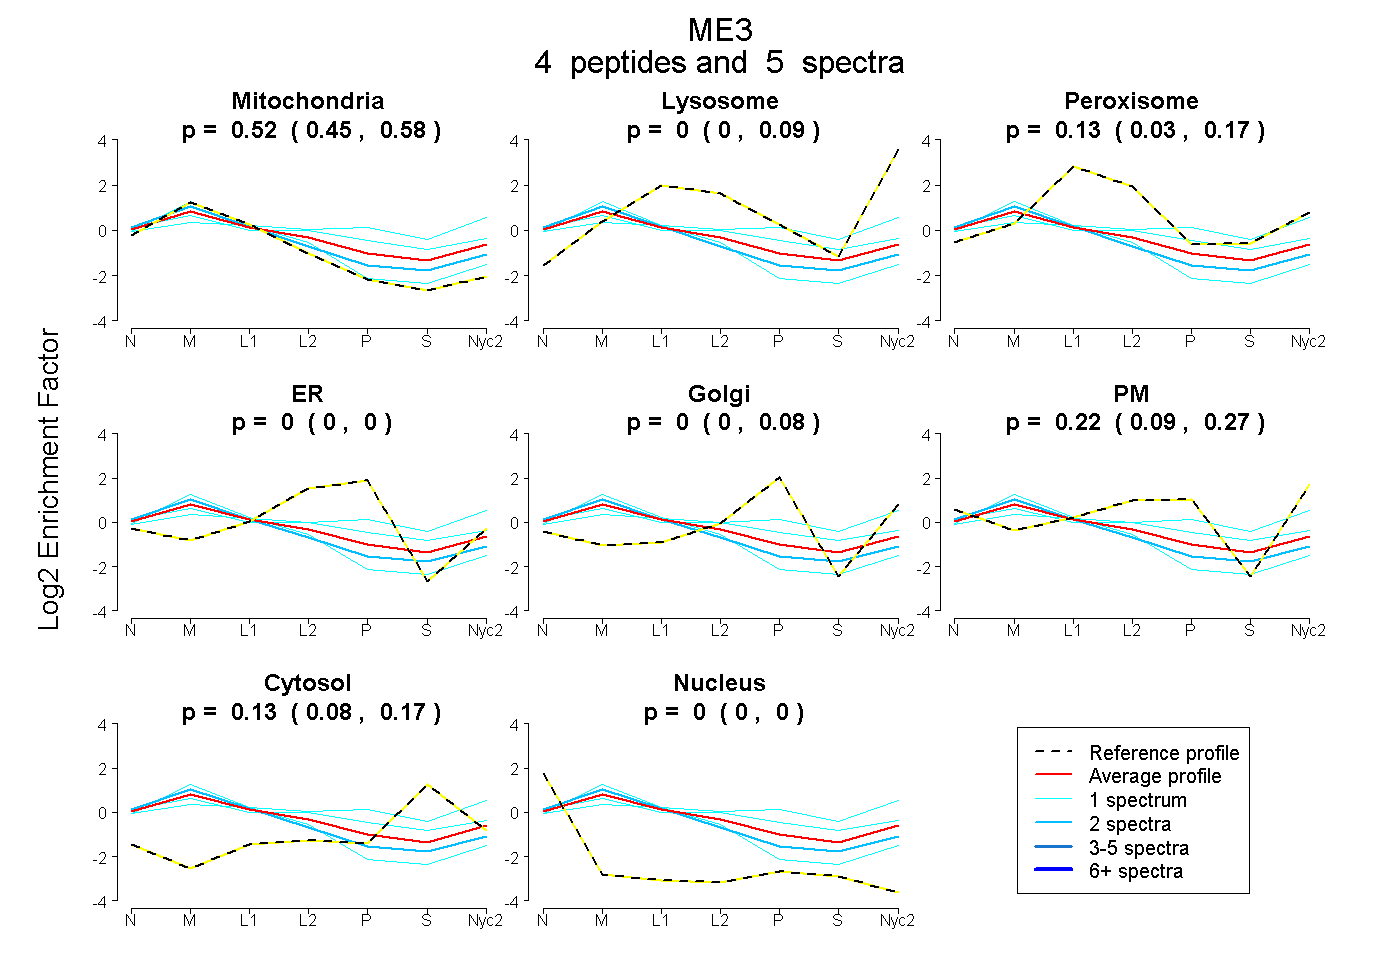
0.455 | 0.582
0.000 | 0.093
0.031 | 0.172
0.000 | 0.000
0.000 | 0.076
0.094 | 0.268
0.077 | 0.174
0.000 | 0.000
1peptide
spectrum
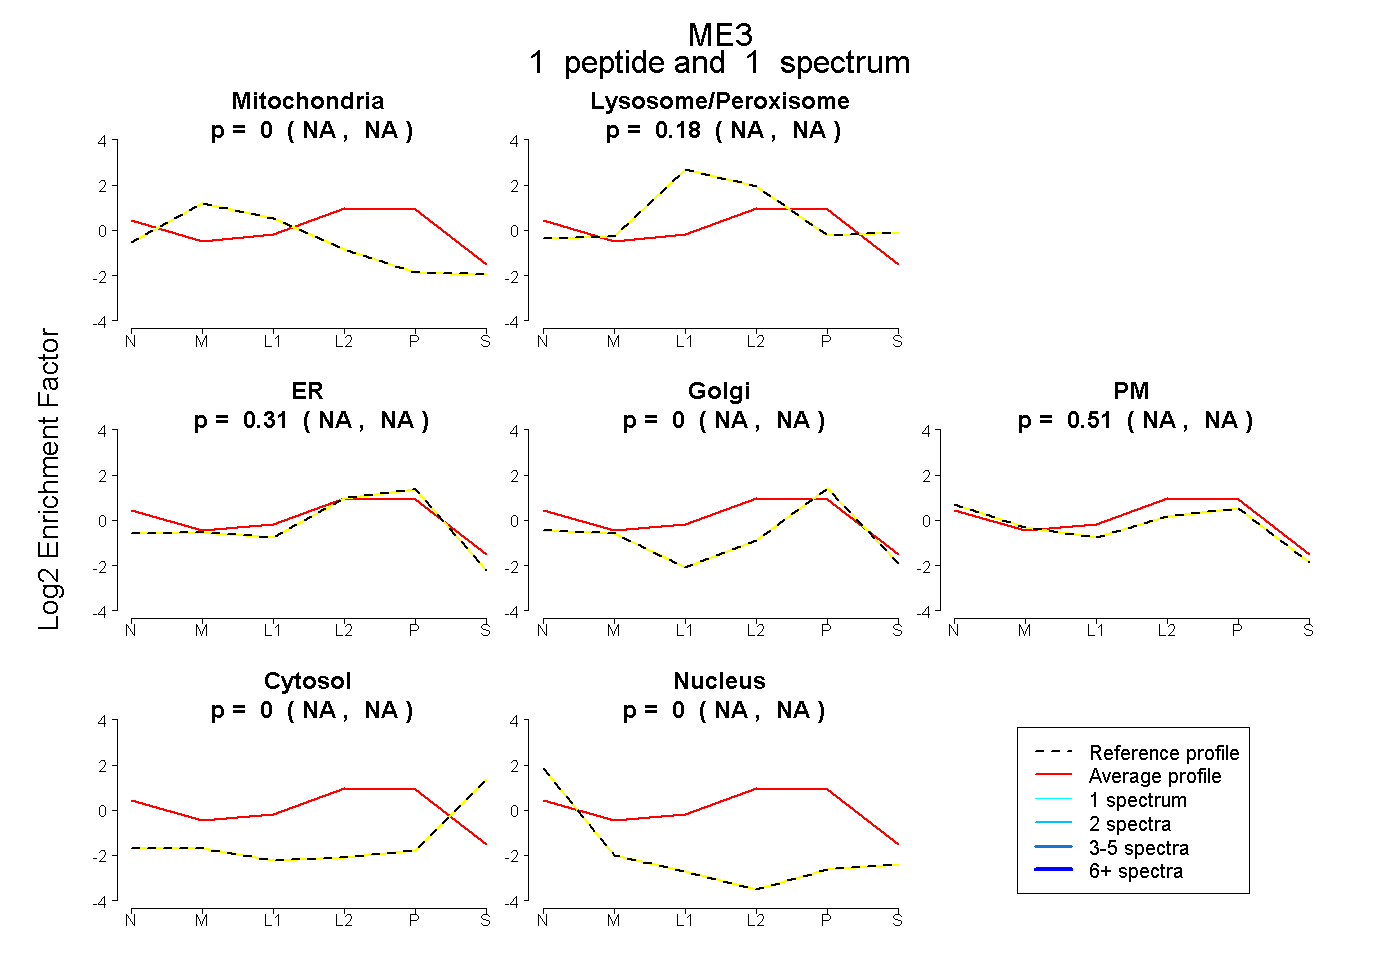
NA | NA
NA | NA
NA | NA
NA | NA
NA | NA
NA | NA
NA | NA
9peptides
spectra
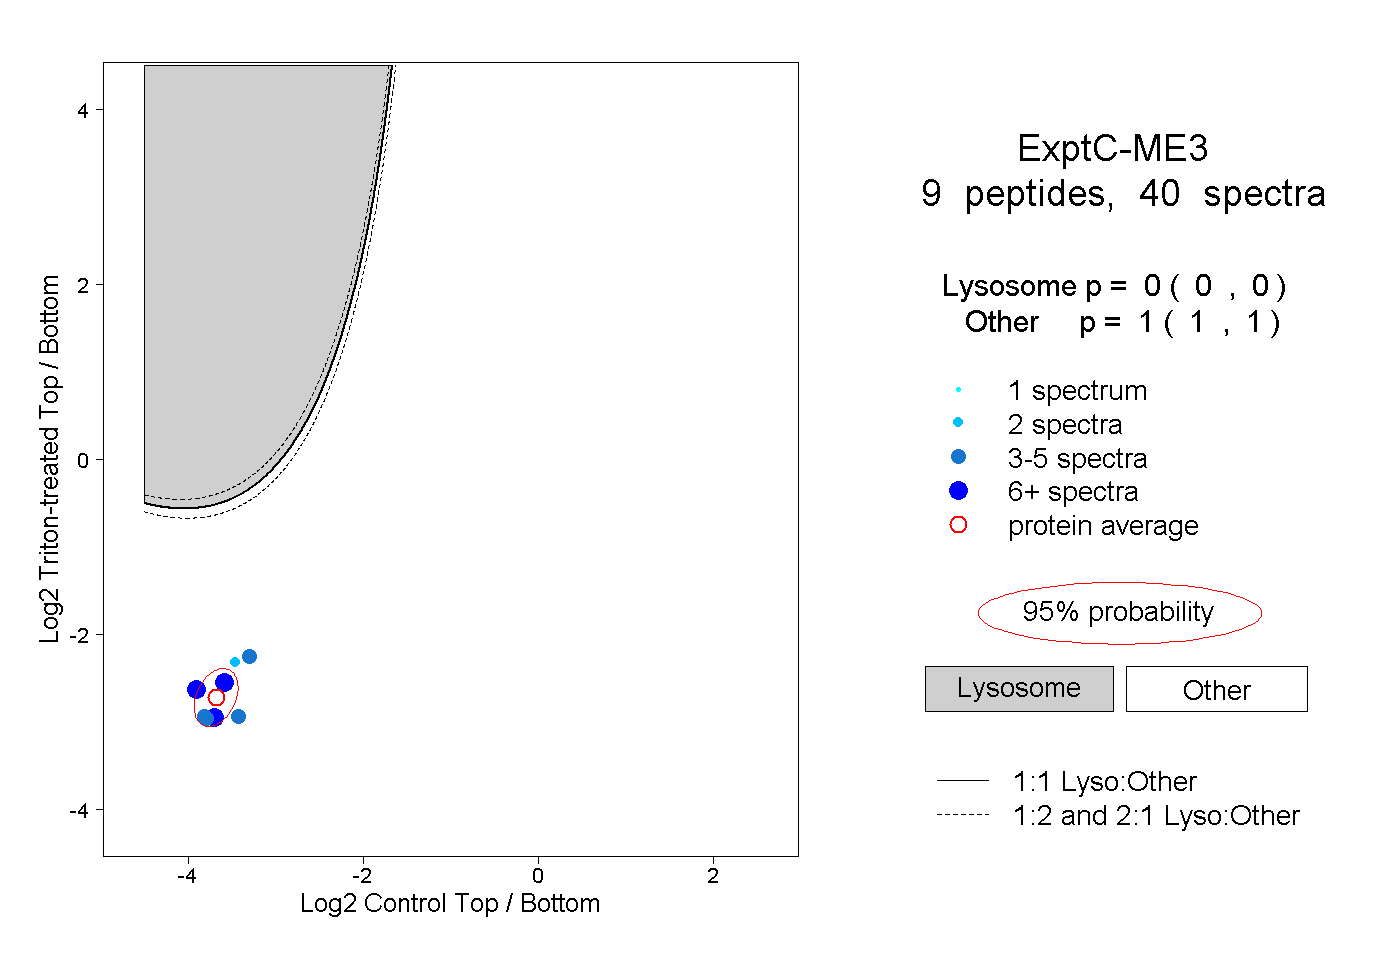
0.000 | 0.000
1.000 | 1.000
2peptides
spectra
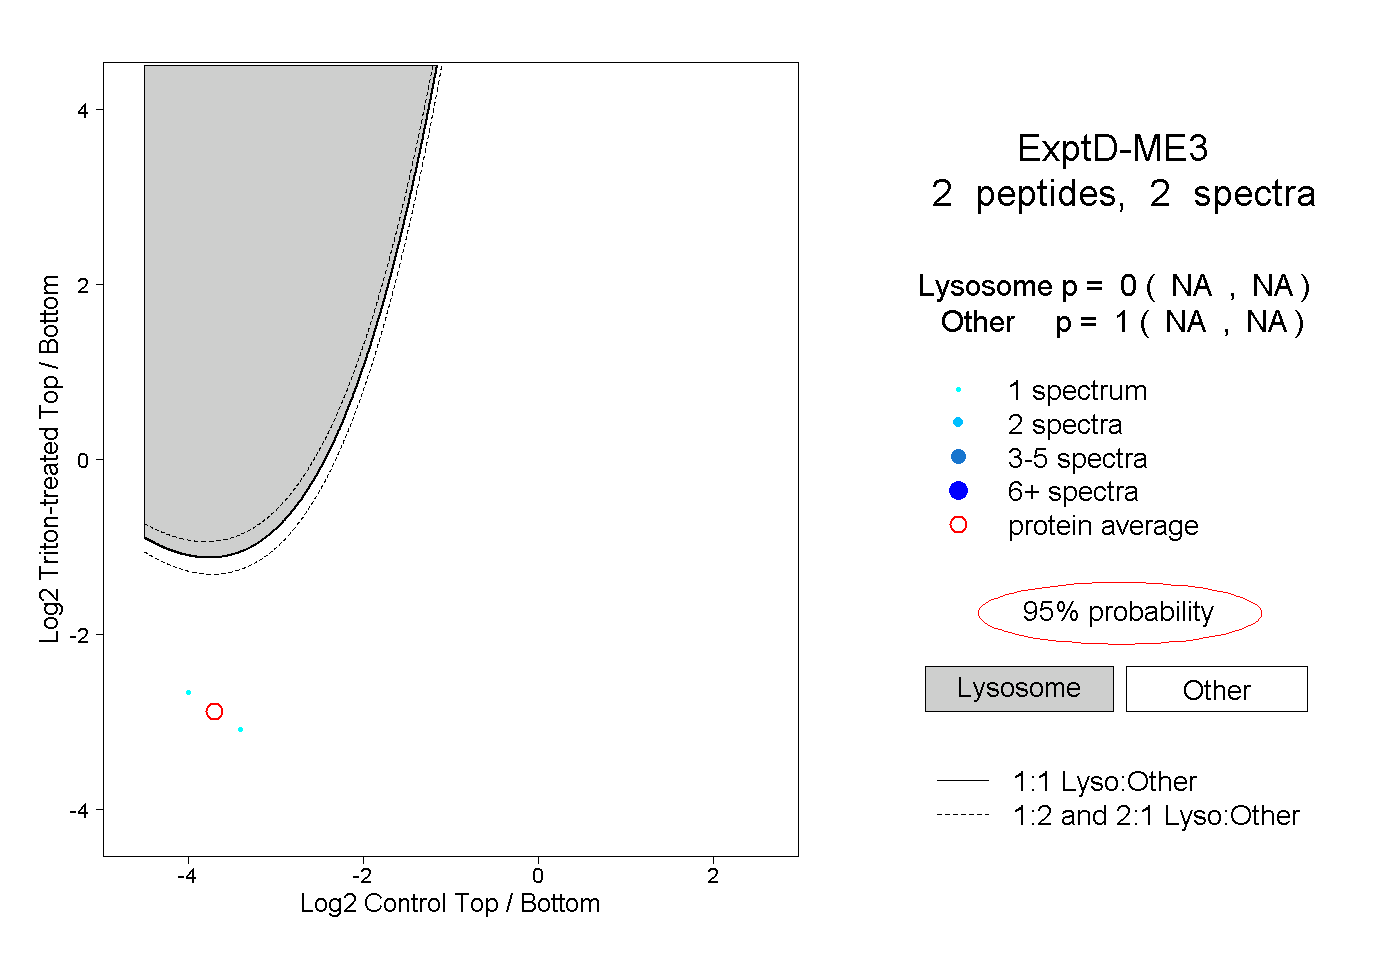
NA | NA
NA | NA