 8
8peptides
spectra
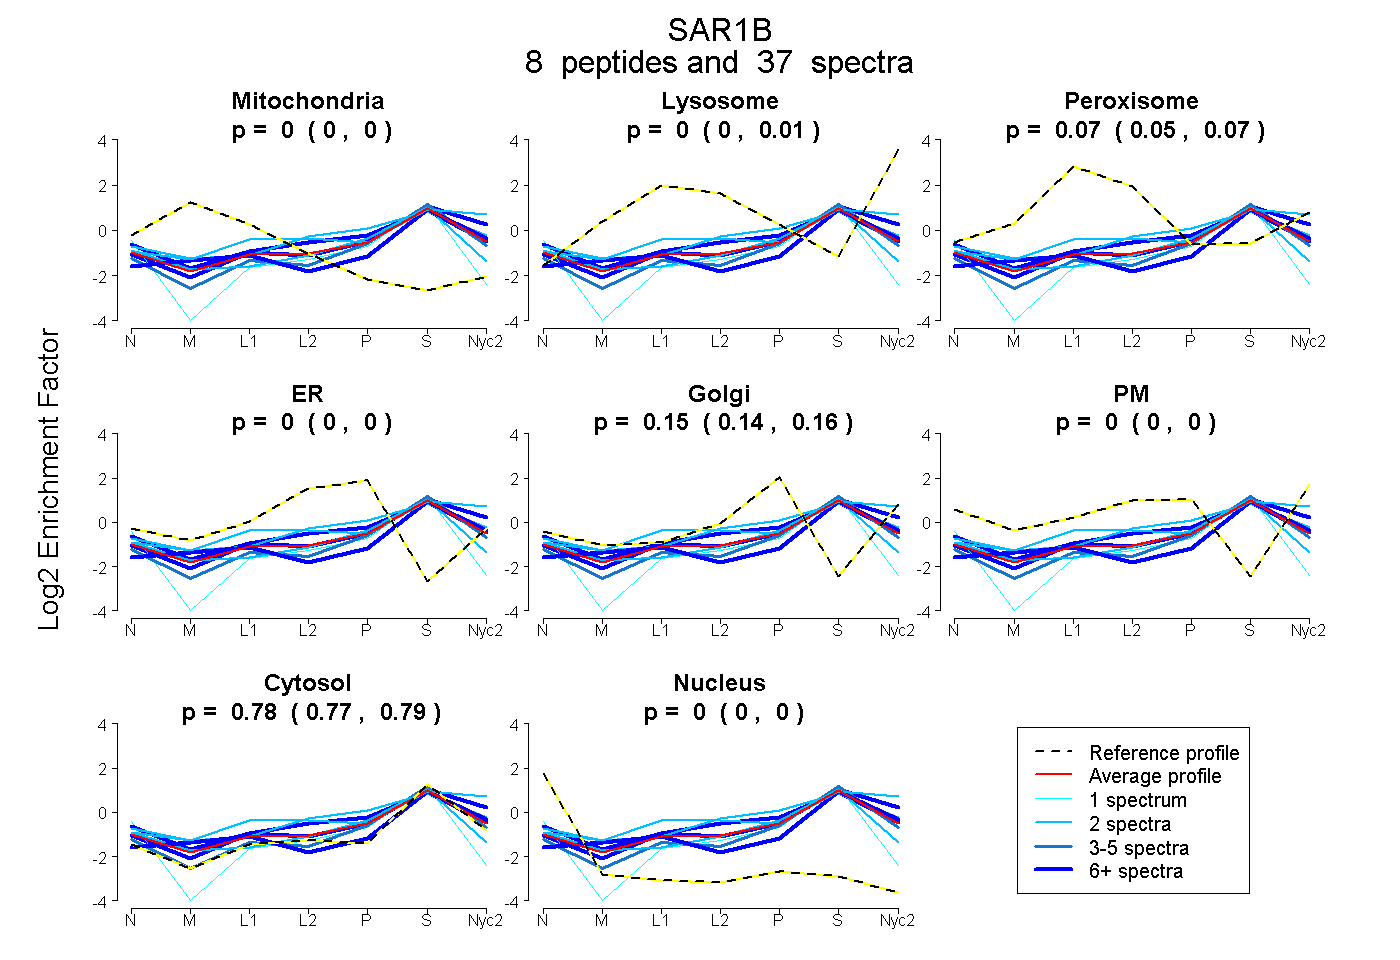
0.000 | 0.000
0.000 | 0.006
0.055 | 0.074
0.000 | 0.000
0.143 | 0.159
0.000 | 0.000
0.773 | 0.789
0.000 | 0.000
3peptides
spectra
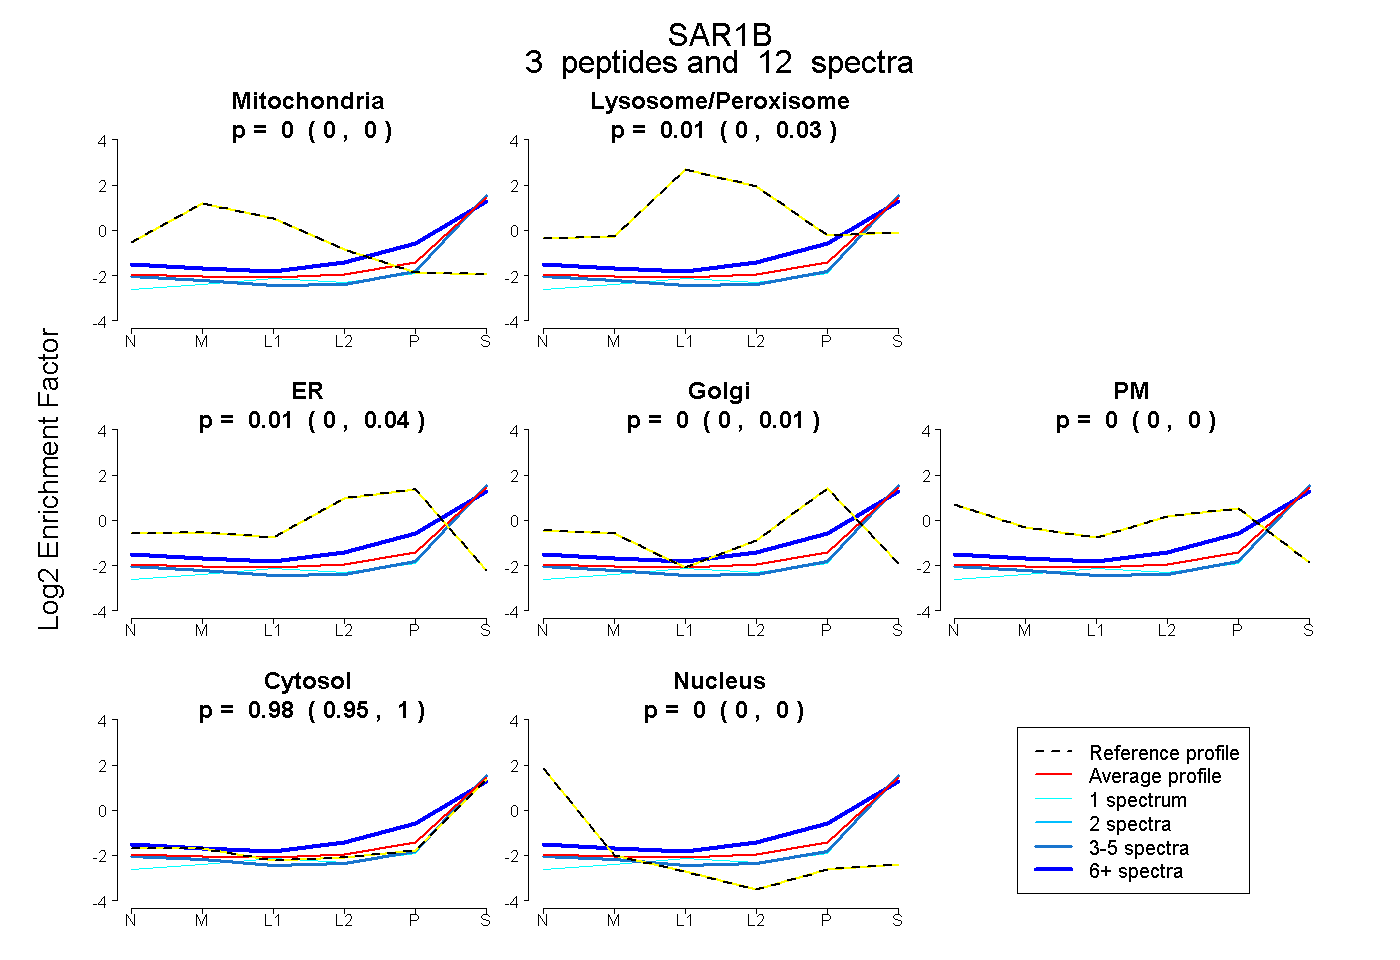
0.000 | 0.000
0.000 | 0.029
0.000 | 0.036
0.000 | 0.010
0.000 | 0.000
0.950 | 1.000
0.000 | 0.000
2peptides
spectra
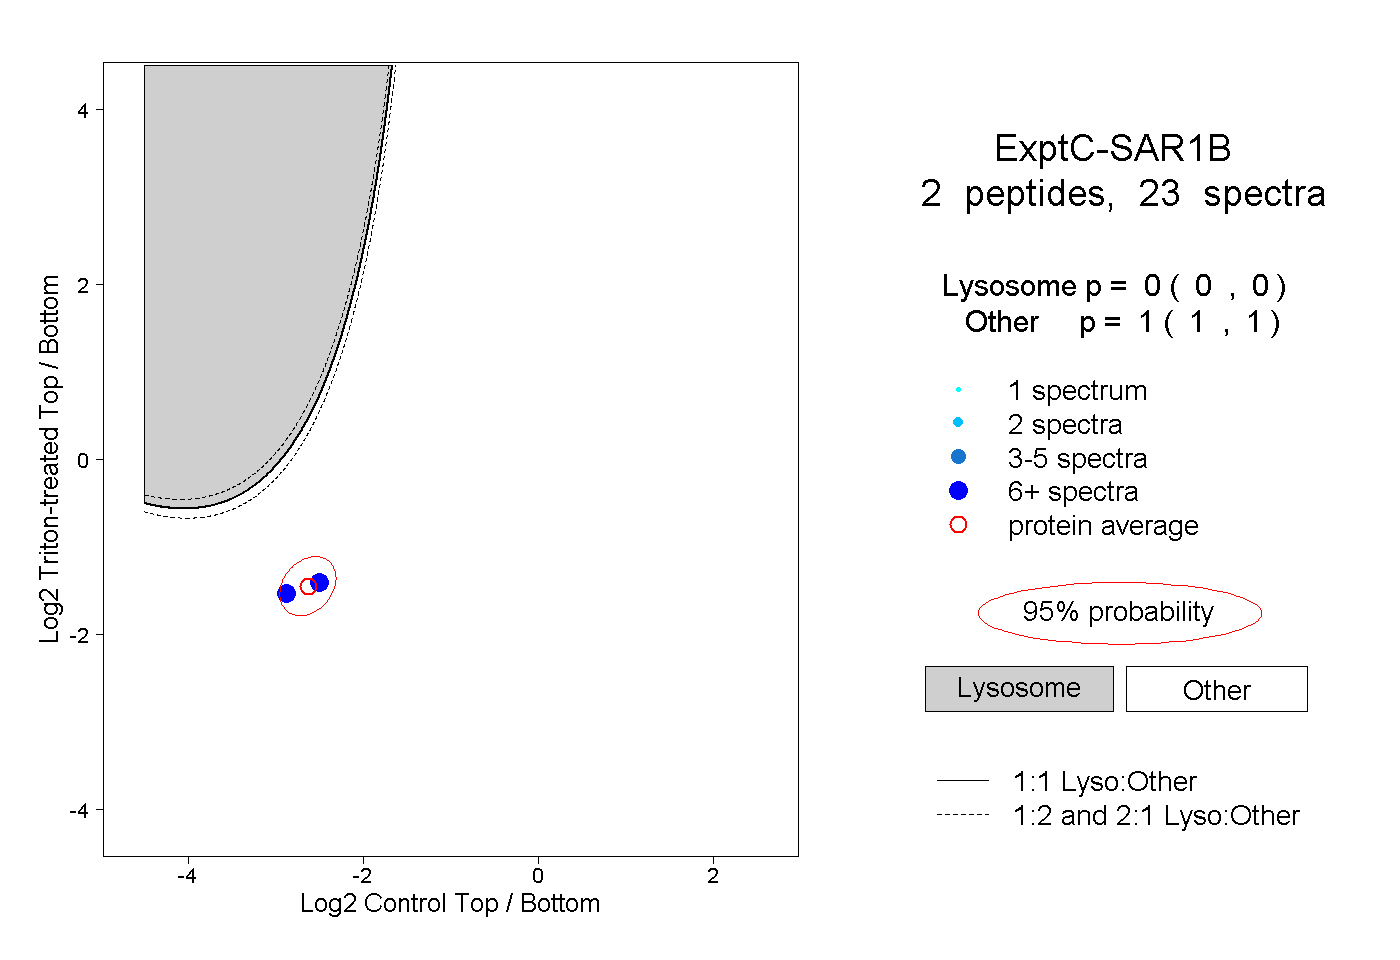
0.000 | 0.000
1.000 | 1.000
1peptide
spectra
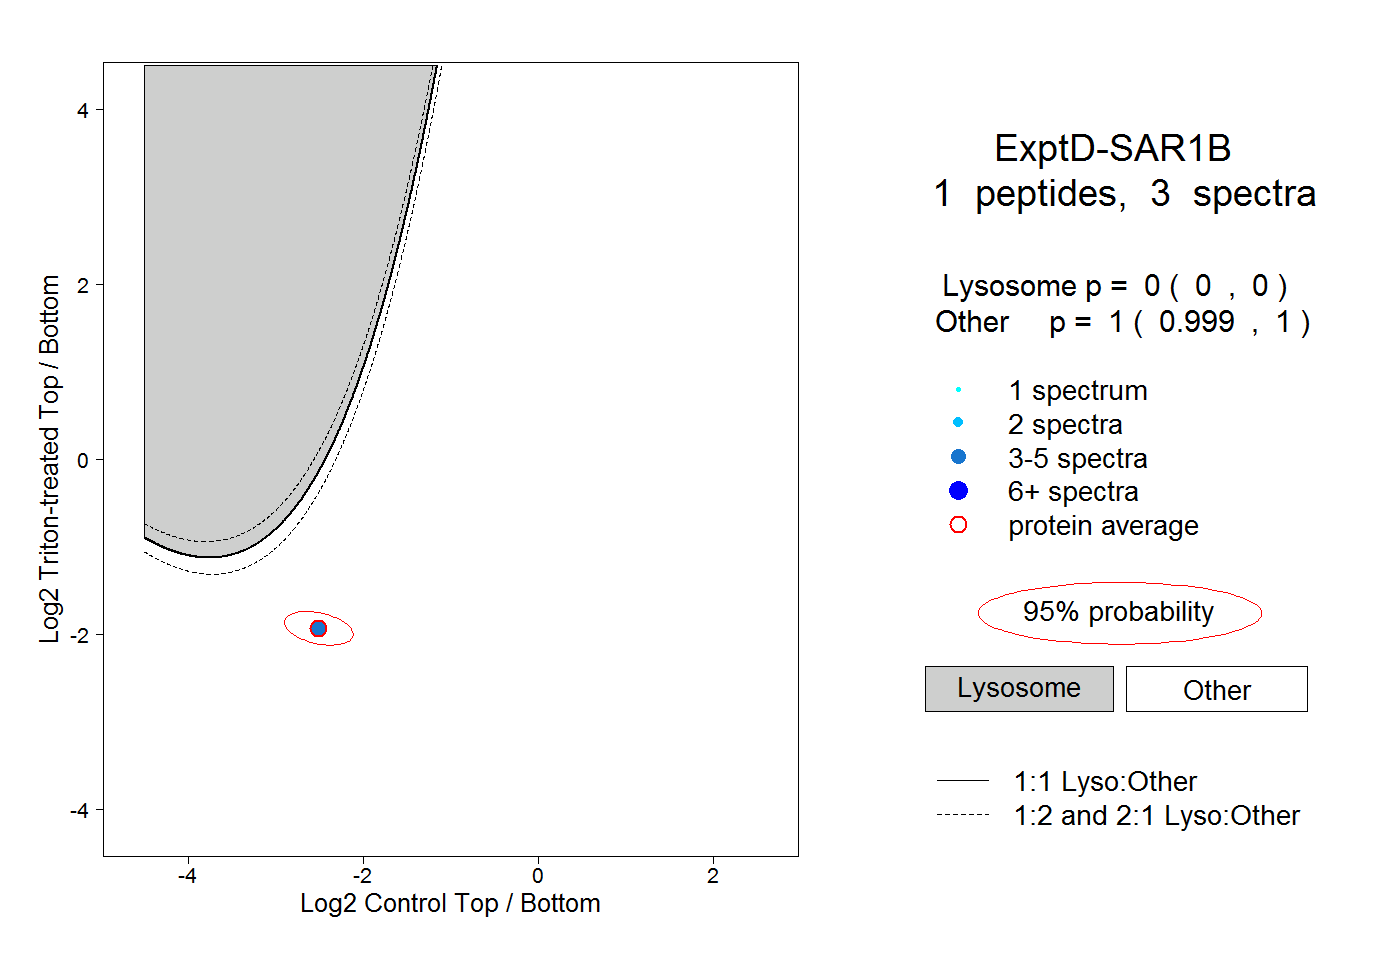
0.000 | 0.000
0.999 | 1.000