 5
5peptides
spectra
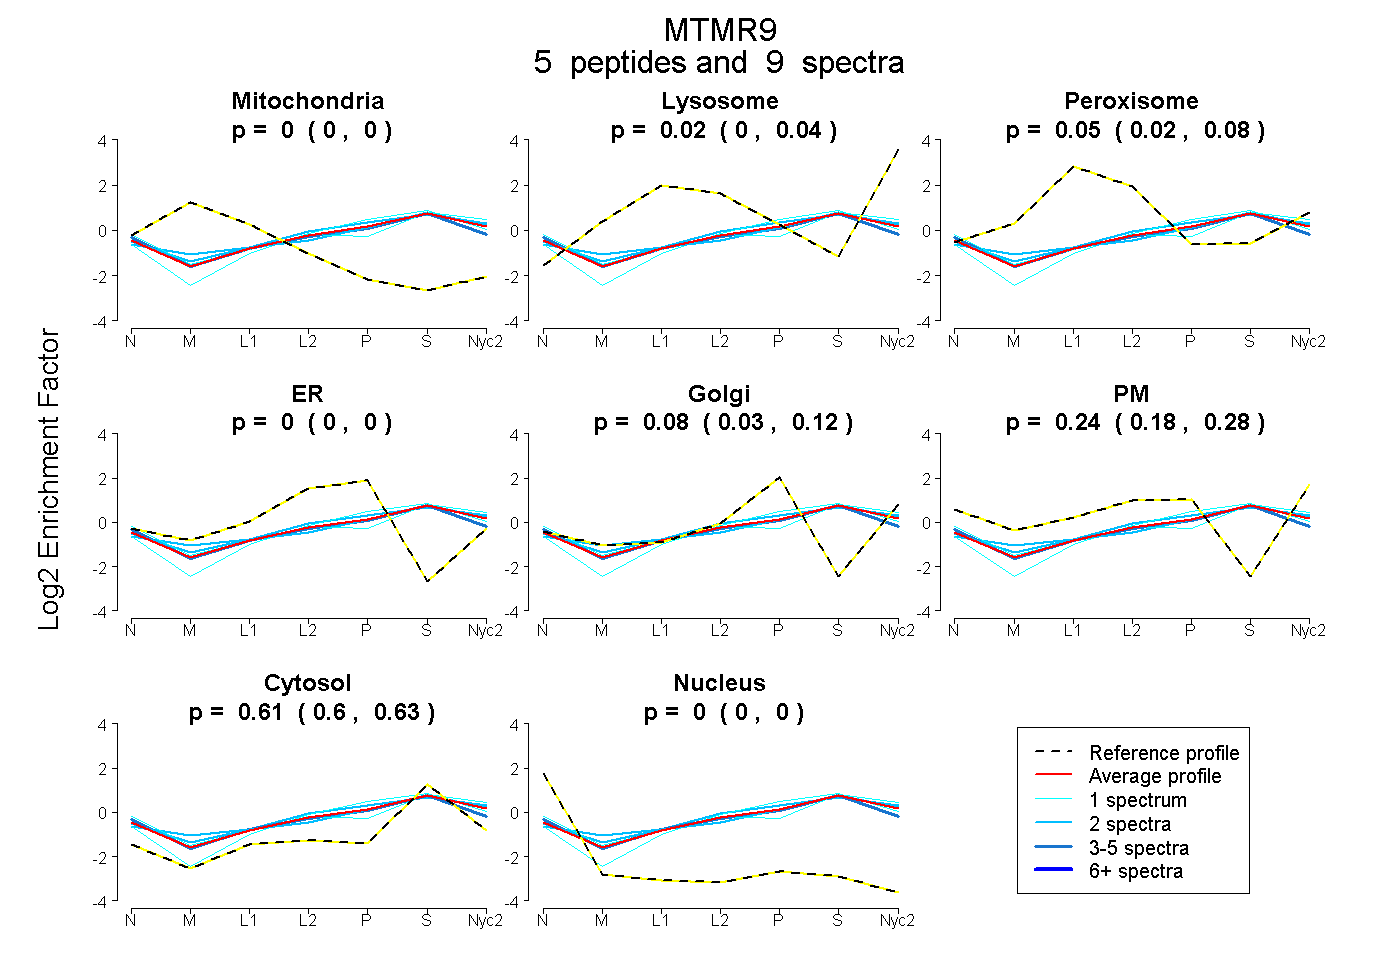
0.000 | 0.000
0.000 | 0.044
0.023 | 0.075
0.000 | 0.000
0.031 | 0.118
0.182 | 0.279
0.595 | 0.626
0.000 | 0.000
5peptides
spectra
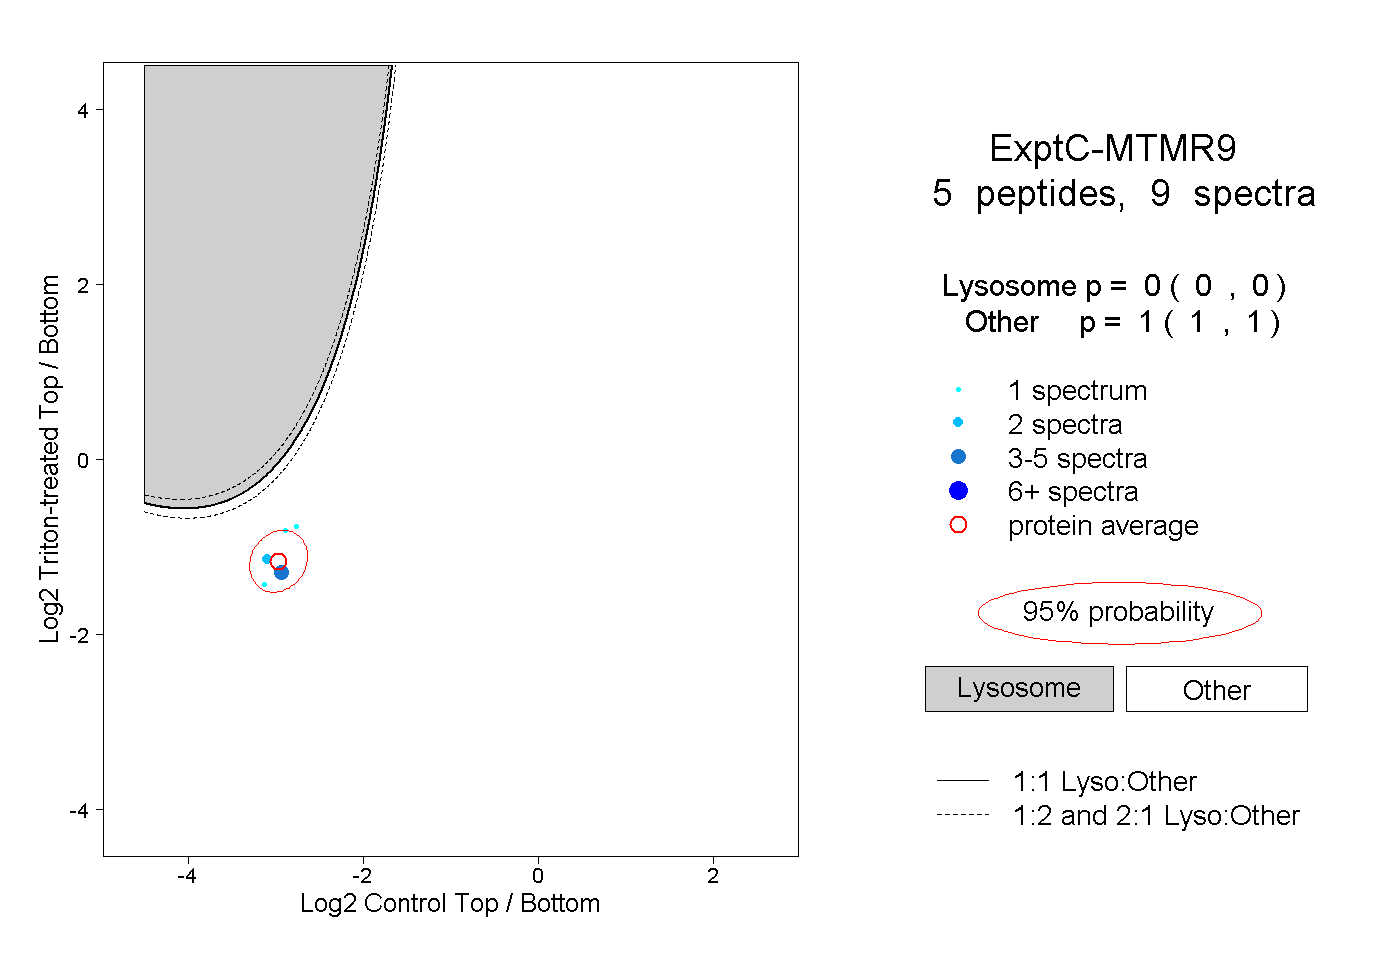
0.000 | 0.000
1.000 | 1.000
1peptide
spectrum
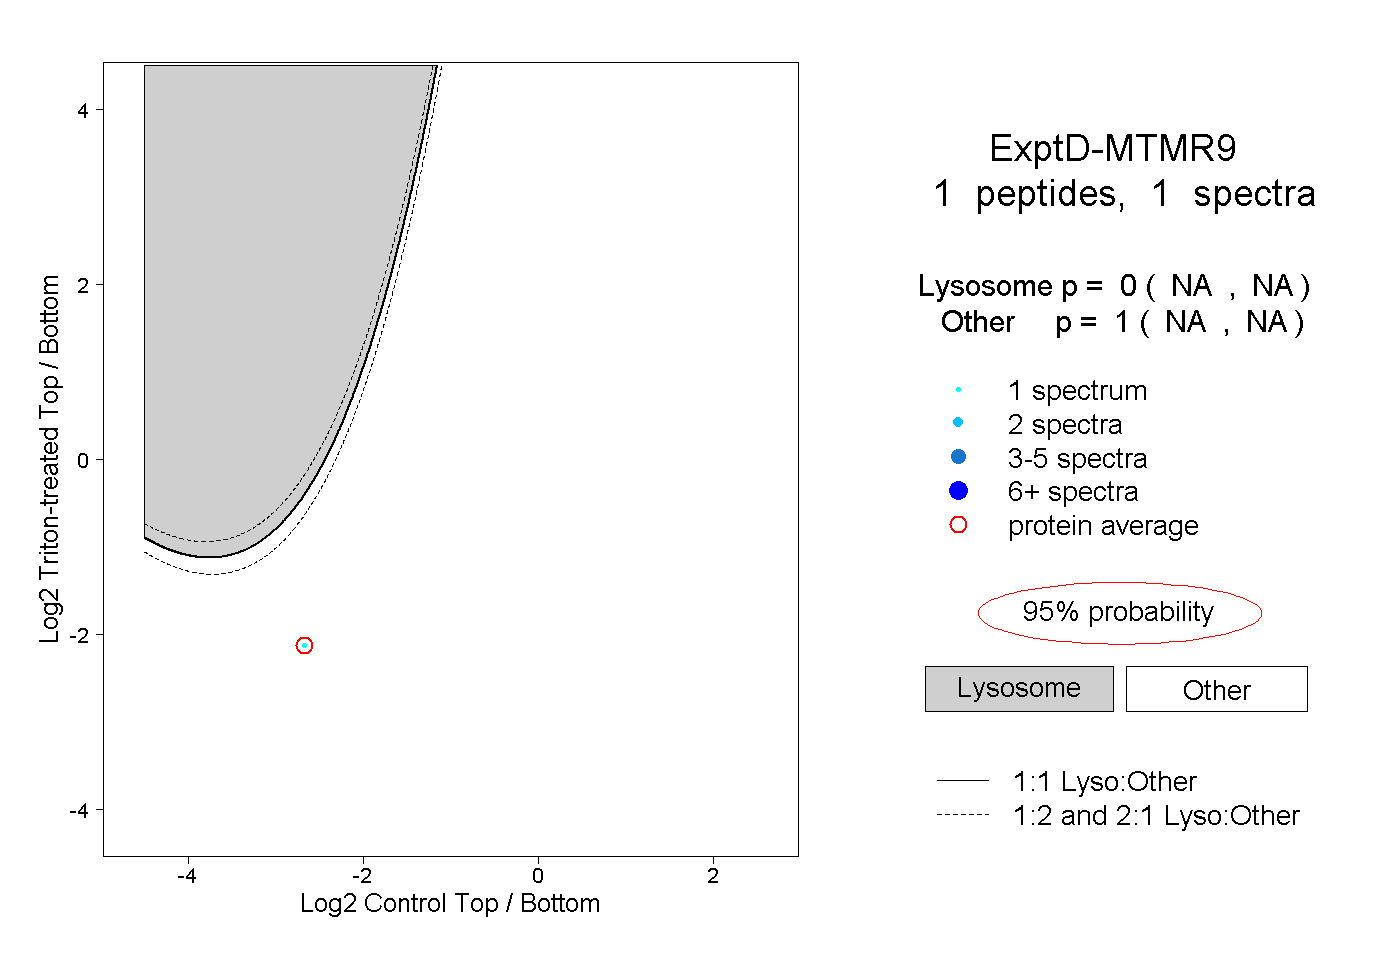
NA | NA
NA | NA