 8
8peptides
spectra
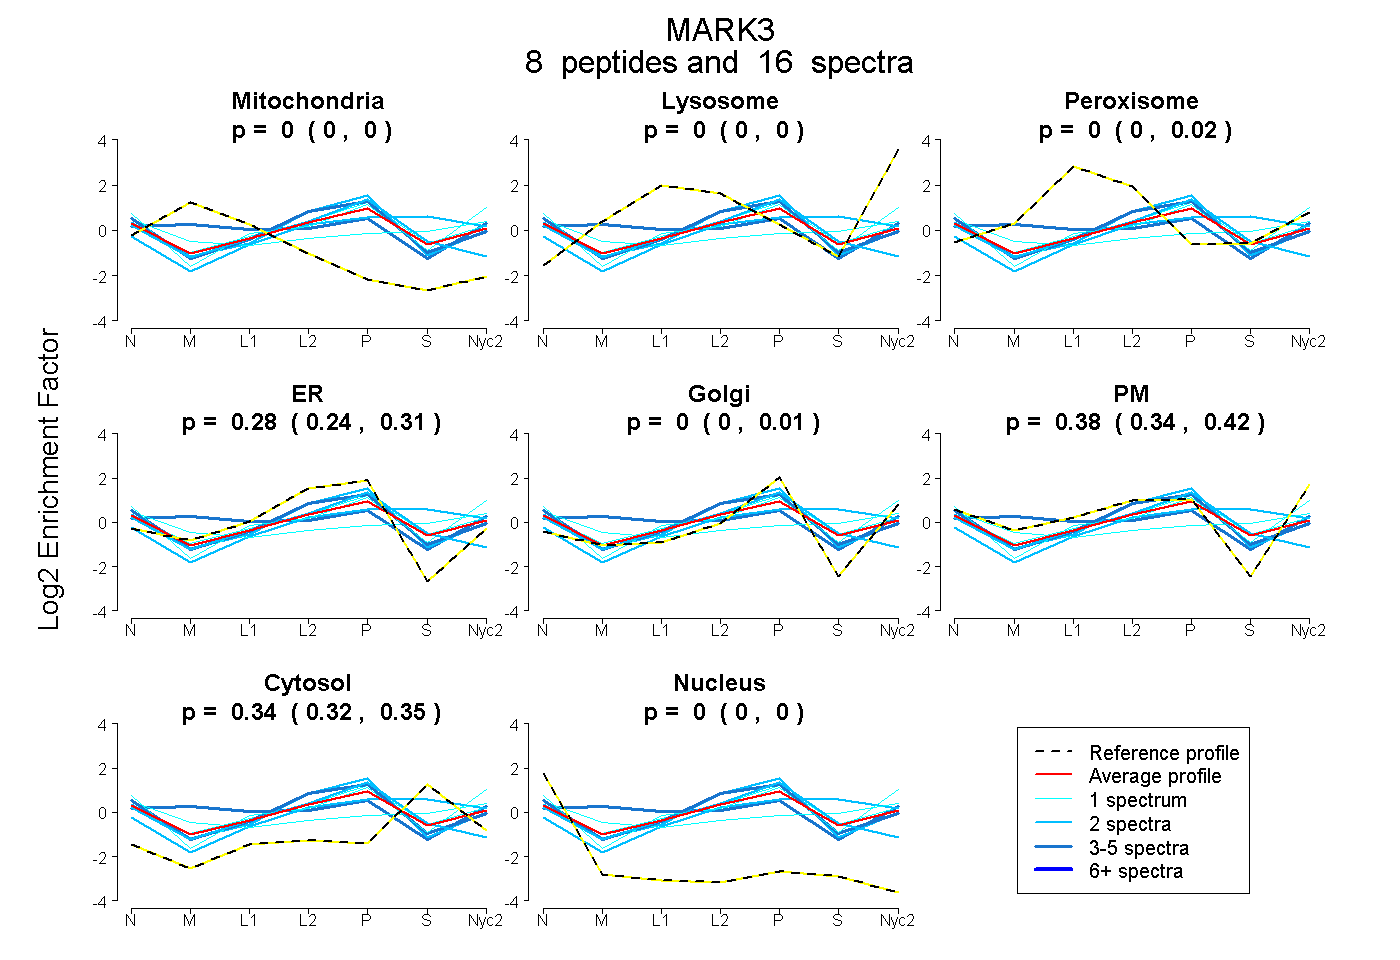
0.000 | 0.000
0.000 | 0.000
0.000 | 0.016
0.238 | 0.314
0.000 | 0.006
0.339 | 0.415
0.322 | 0.349
0.000 | 0.000
8peptides
spectra
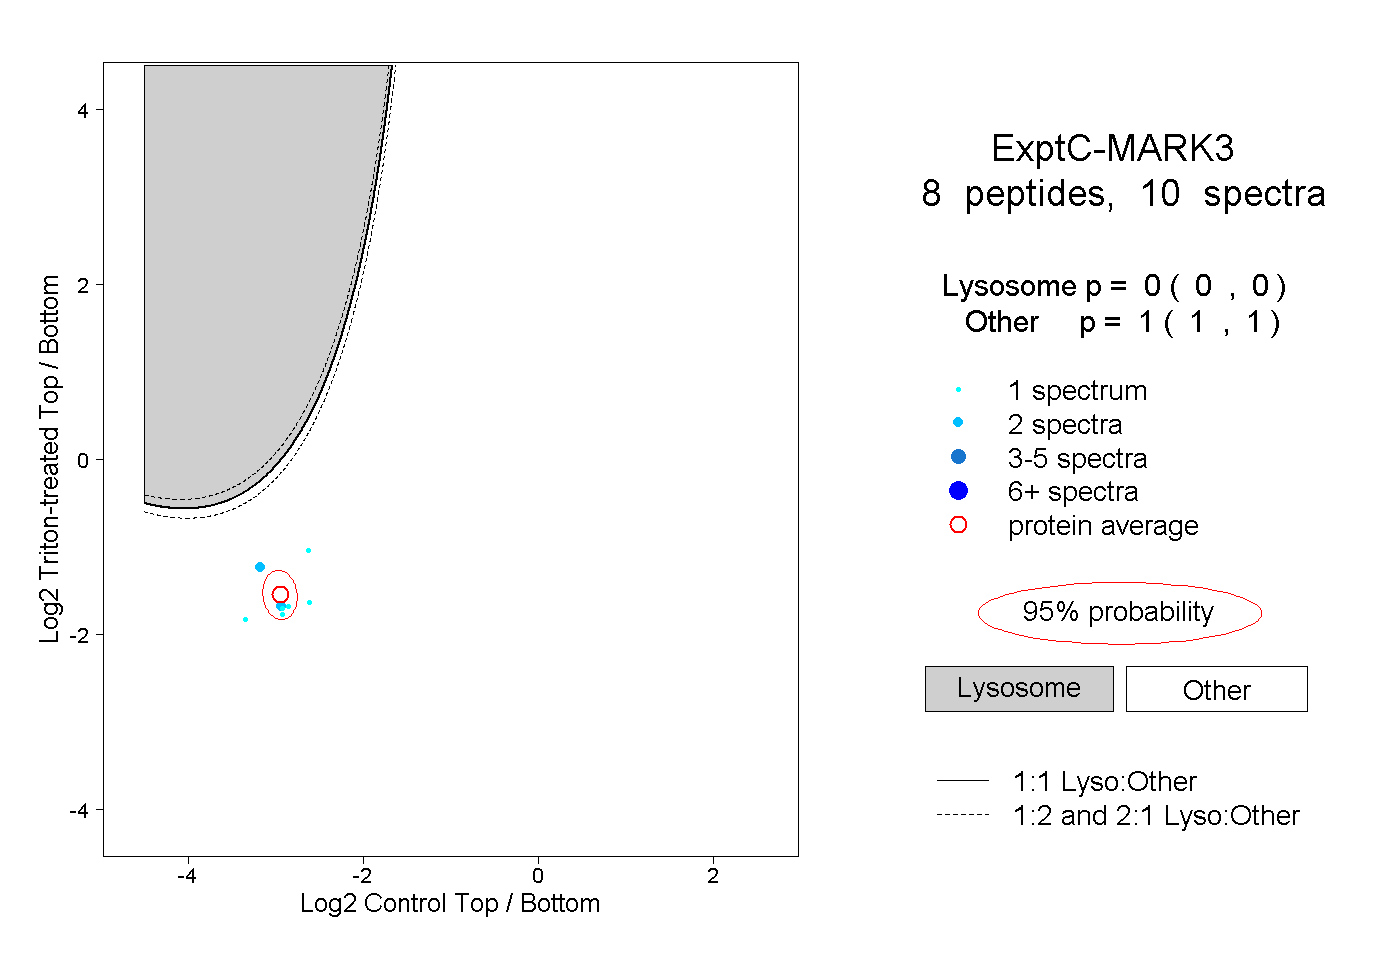
0.000 | 0.000
1.000 | 1.000
2peptides
spectra
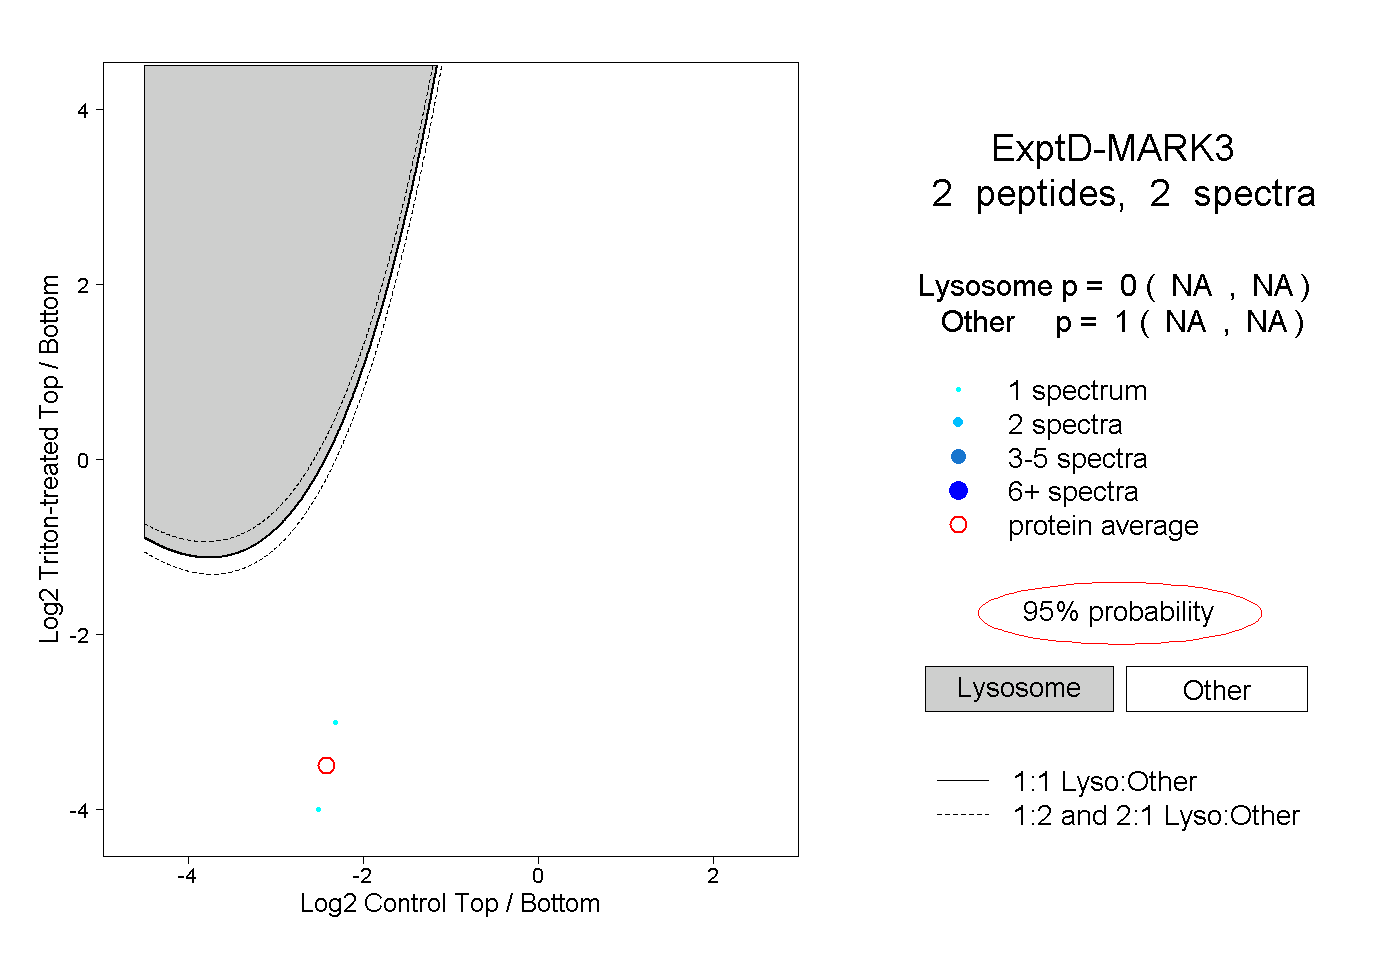
NA | NA
NA | NA