 3
3peptides
spectra
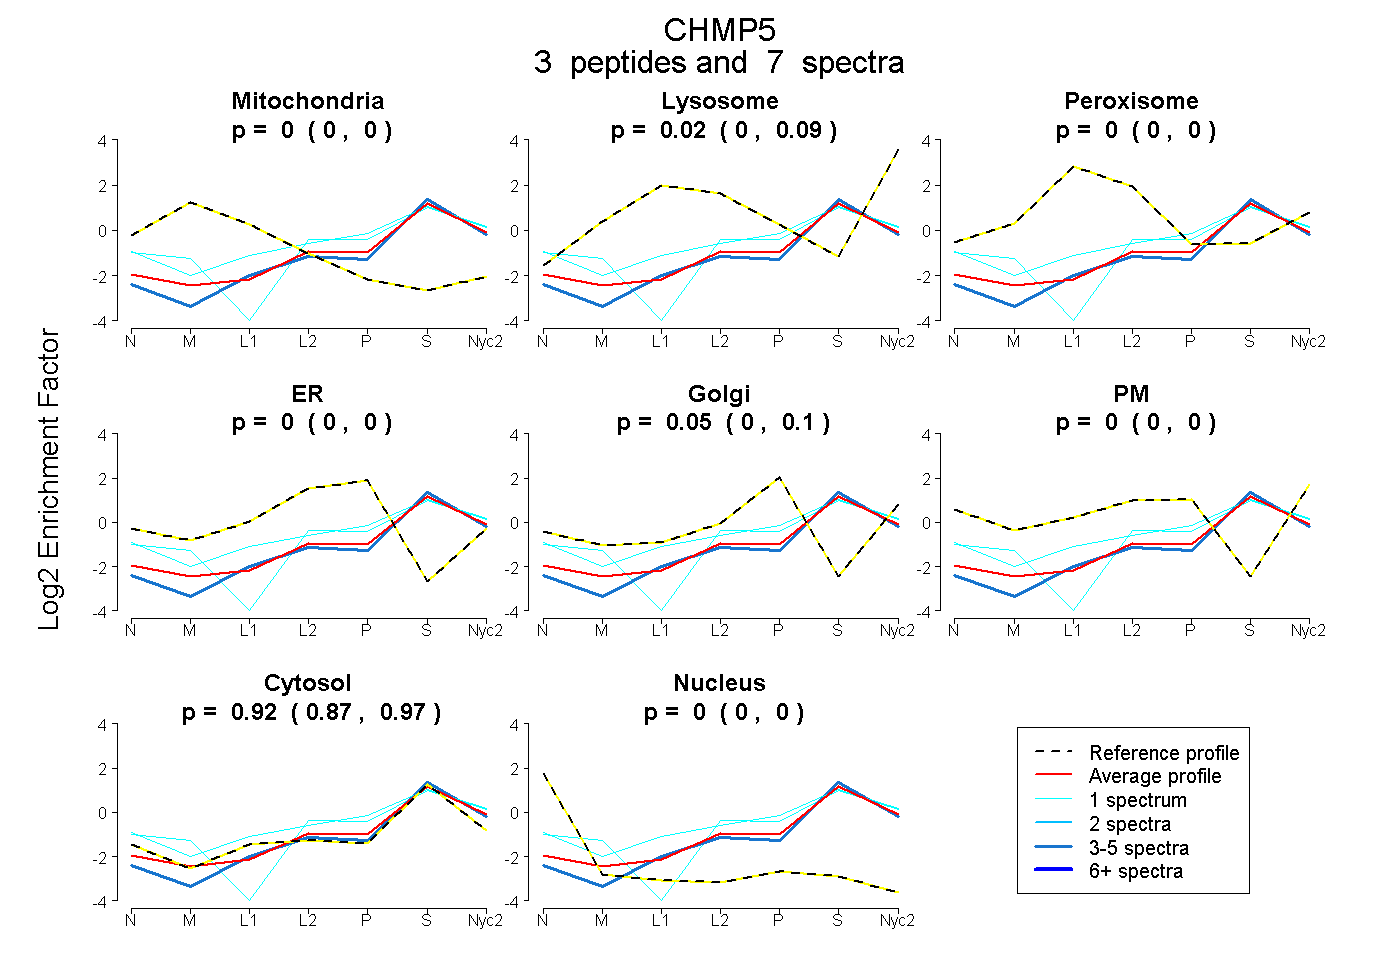
0.000 | 0.000
0.000 | 0.093
0.000 | 0.000
0.000 | 0.000
0.000 | 0.100
0.000 | 0.000
0.866 | 0.968
0.000 | 0.000
3peptides
spectra
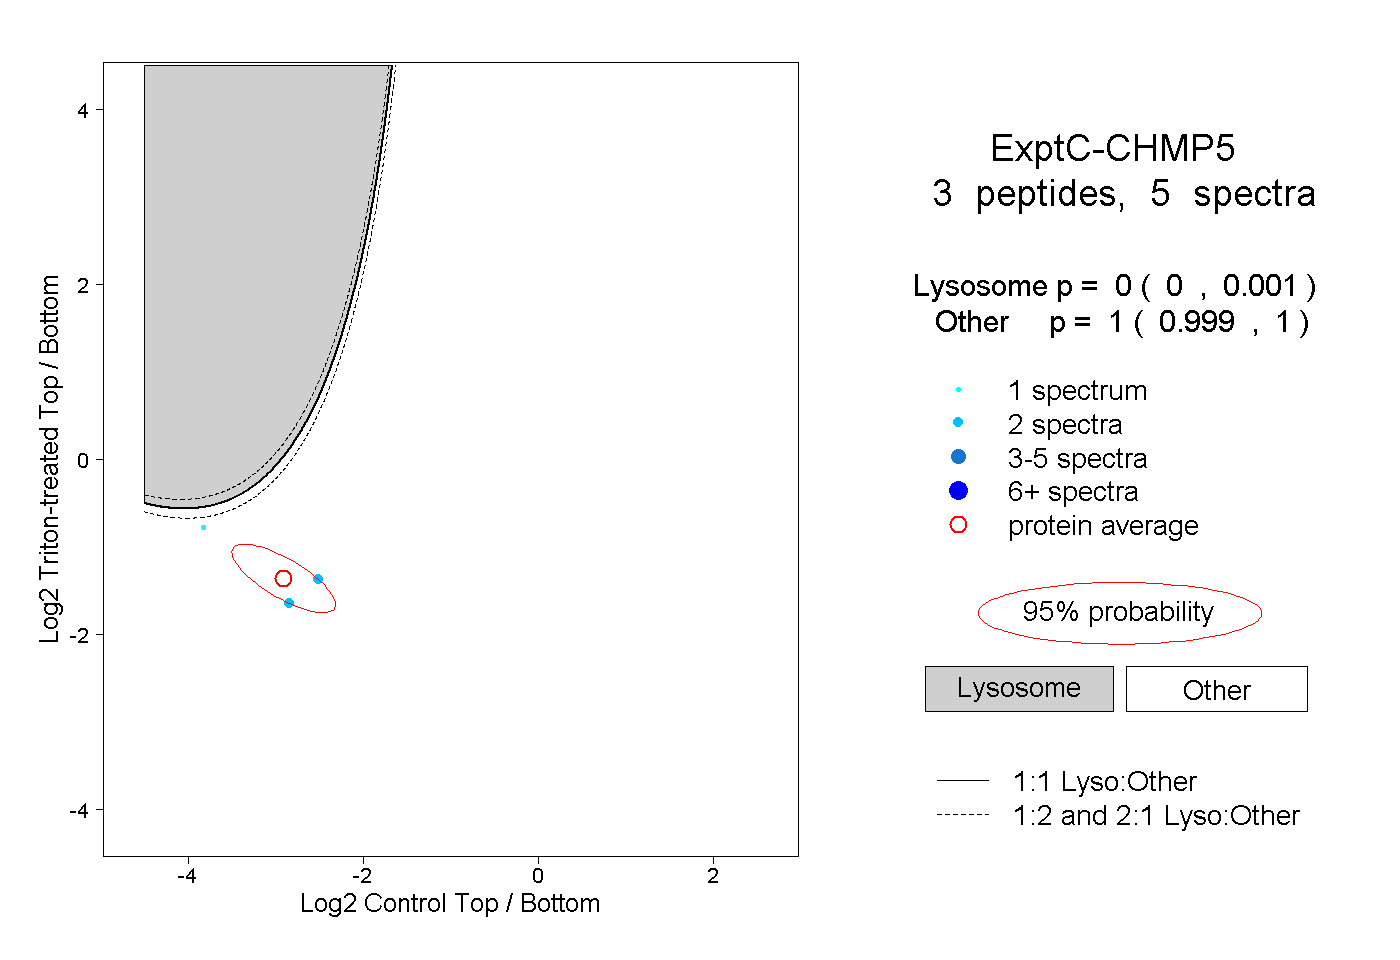
0.000 | 0.001
0.999 | 1.000
1peptide
spectrum
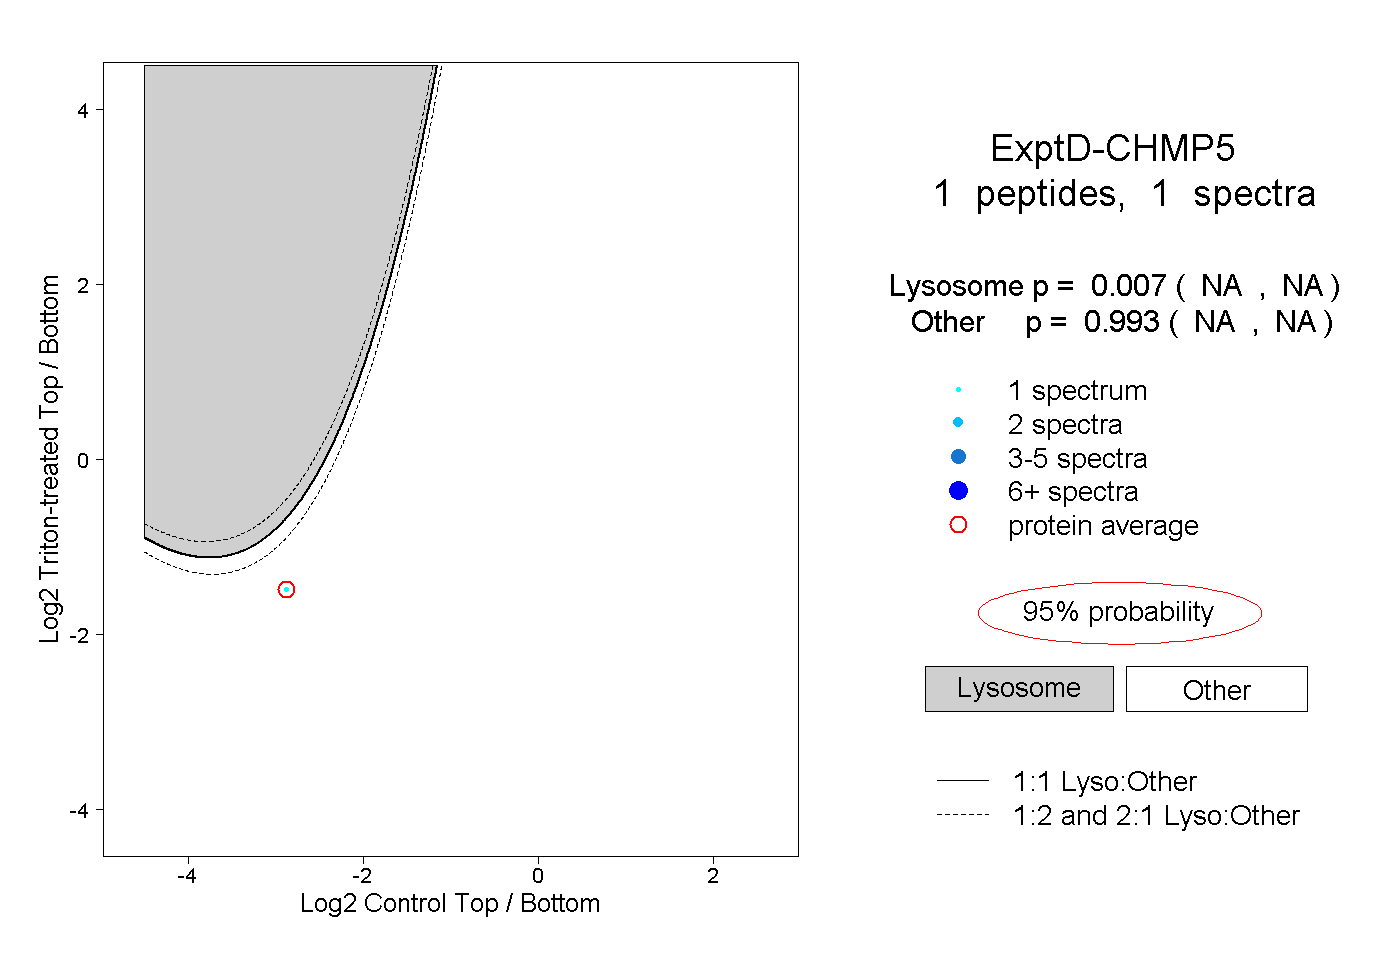
NA | NA
NA | NA