 3
3peptides
spectra
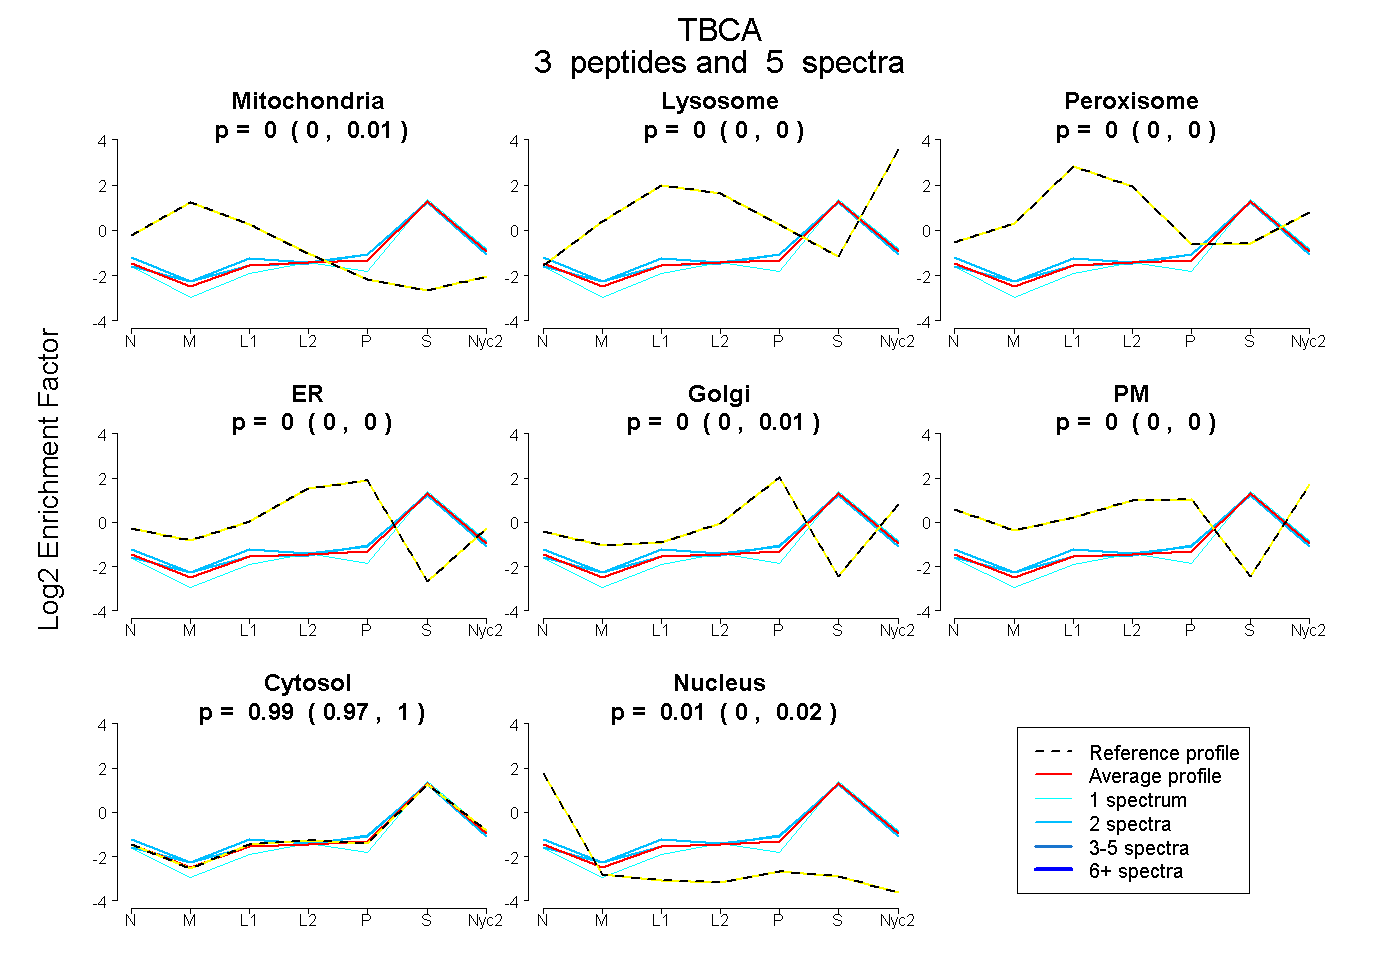
0.000 | 0.013
0.000 | 0.000
0.000 | 0.000
0.000 | 0.000
0.000 | 0.012
0.000 | 0.000
0.973 | 0.999
0.000 | 0.021
2peptides
spectra
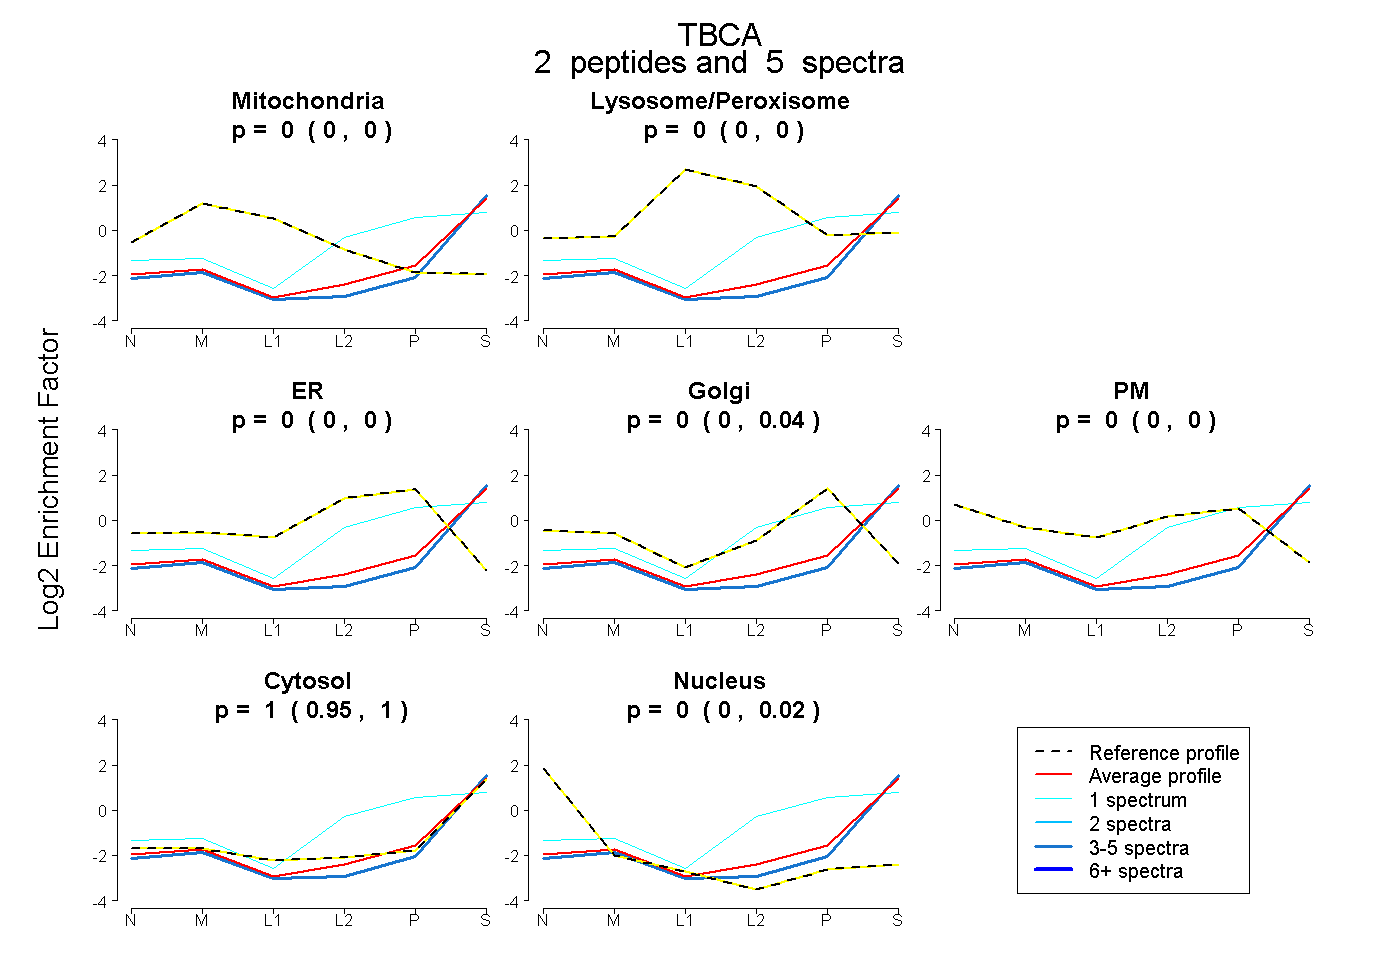
0.000 | 0.000
0.000 | 0.000
0.000 | 0.000
0.000 | 0.044
0.000 | 0.000
0.947 | 1.000
0.000 | 0.018
3peptides
spectra
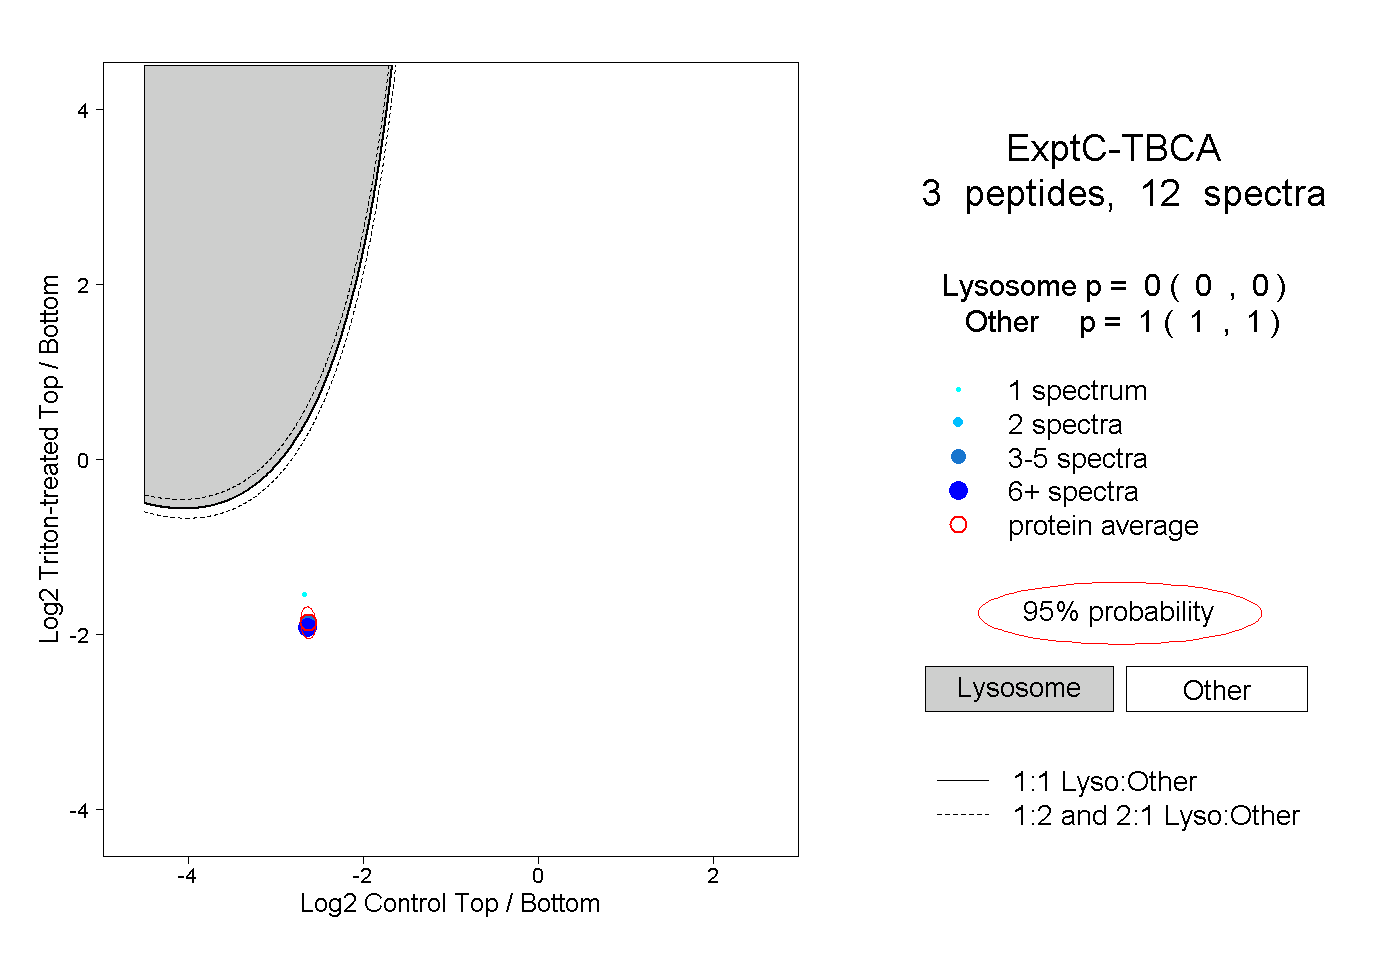
0.000 | 0.000
1.000 | 1.000
2peptides
spectra
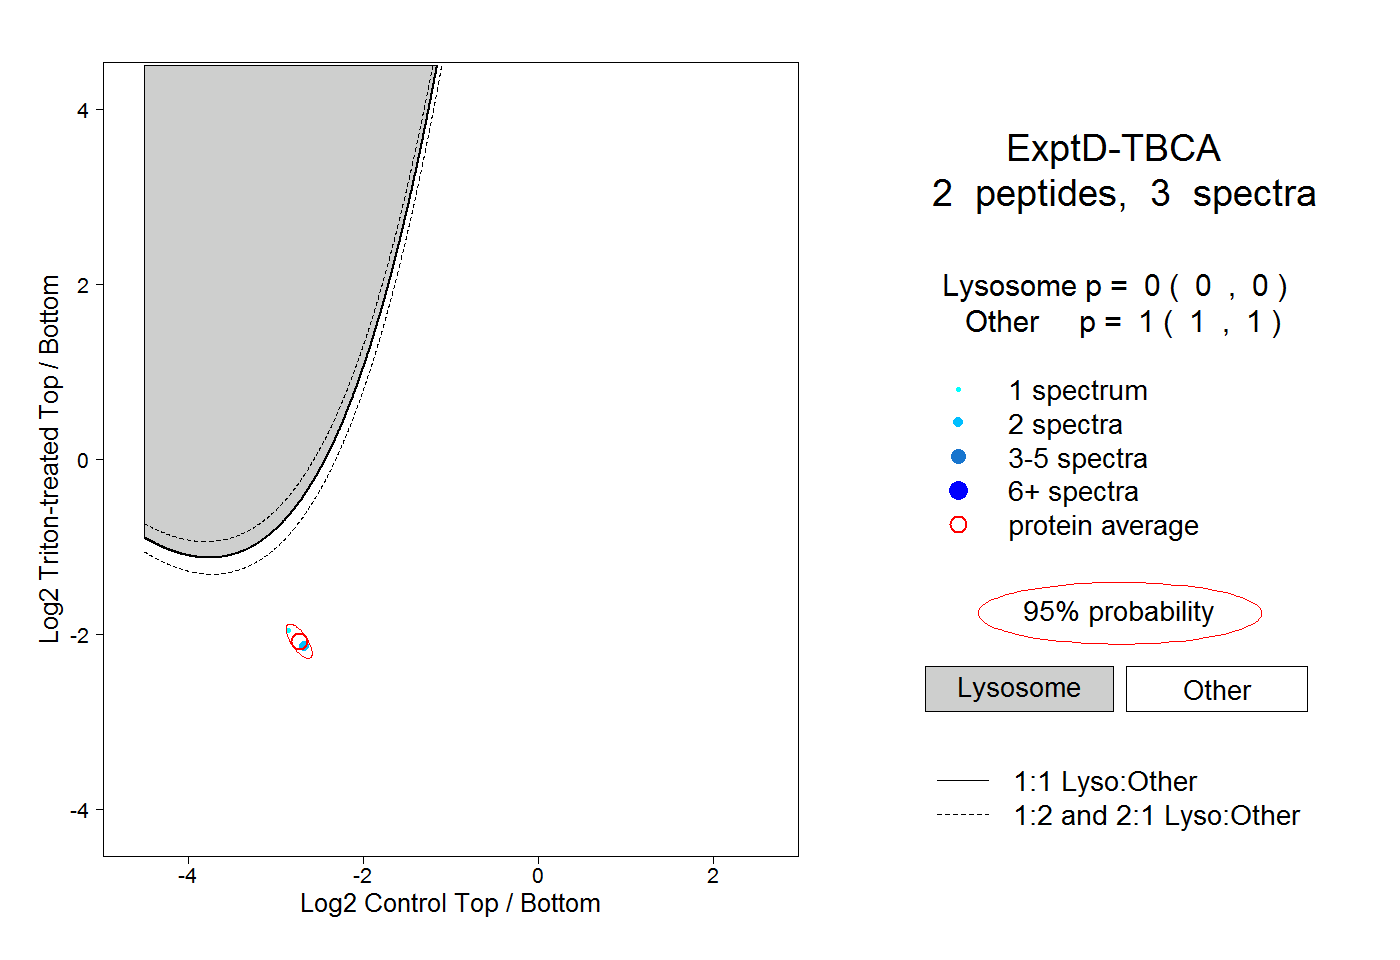
0.000 | 0.000
1.000 | 1.000