 3
3peptides
spectra
0.000 | 0.013
0.000 | 0.000
0.000 | 0.000
0.000 | 0.000
0.000 | 0.012
0.000 | 0.000
0.973 | 0.999
0.000 | 0.021
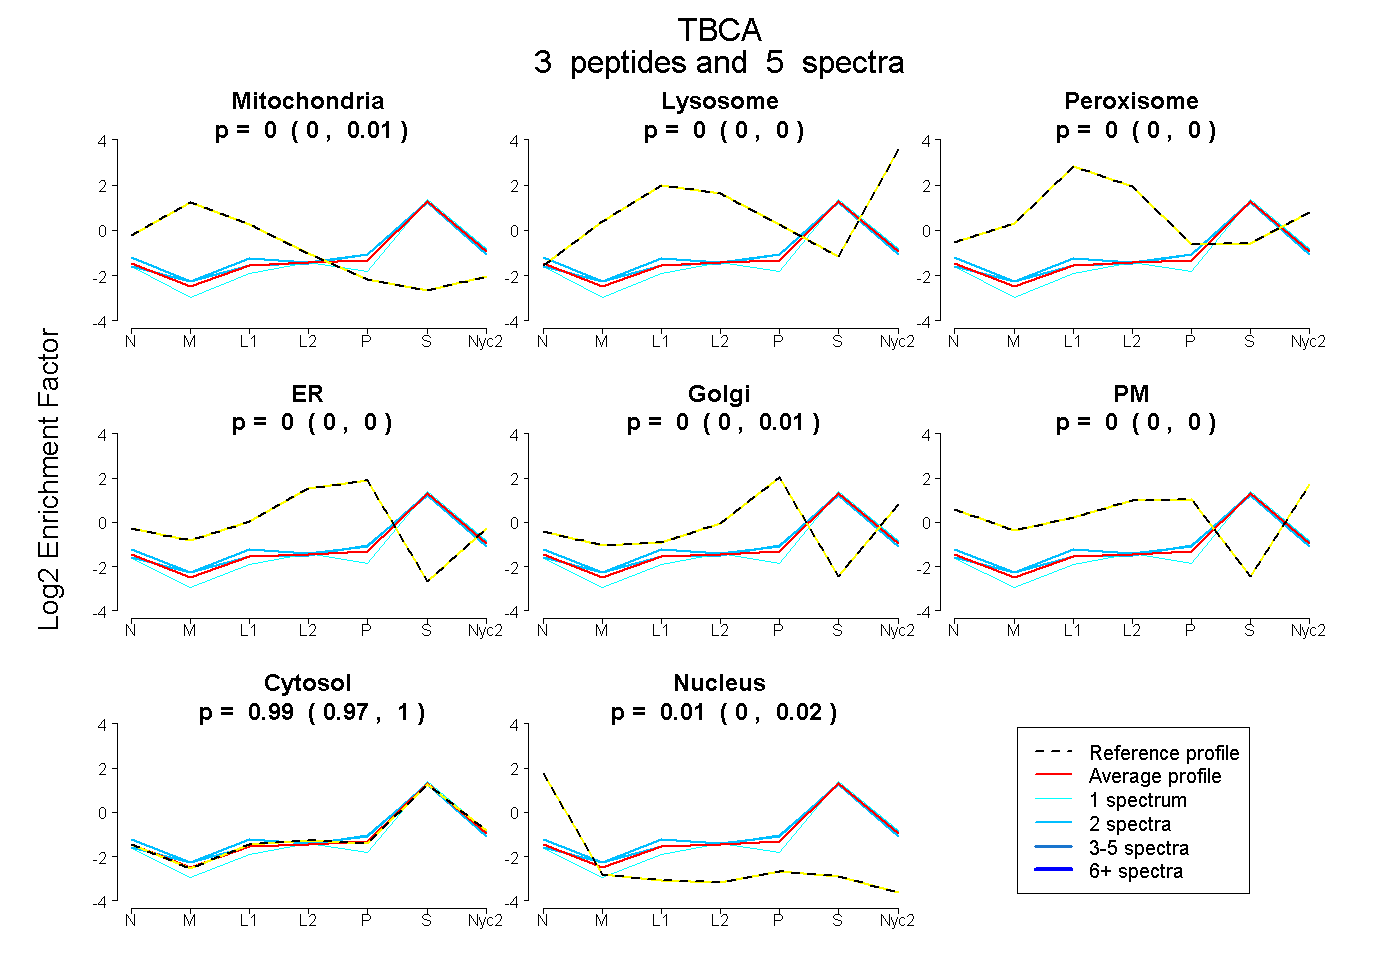
| Plot | Mito | Lyso | Perox | ER | Golgi | PM | Cytosol | Nucleus | |||||
| Expt A |
3 peptides |
5 spectra |
|
0.000 0.000 | 0.013 |
0.000 0.000 | 0.000 |
0.000 0.000 | 0.000 |
0.000 0.000 | 0.000 |
0.000 0.000 | 0.012 |
0.000 0.000 | 0.000 |
0.991 0.973 | 0.999 |
0.009 0.000 | 0.021 |
| 2 spectra, AEDGENYAIK | 0.003 | 0.000 | 0.000 | 0.000 | 0.029 | 0.000 | 0.939 | 0.028 | ||
| 1 spectrum, DLEEAEEYK | 0.000 | 0.000 | 0.000 | 0.000 | 0.000 | 0.000 | 0.988 | 0.012 | ||
| 2 spectra, MMIPDCQR | 0.007 | 0.000 | 0.015 | 0.000 | 0.017 | 0.000 | 0.961 | 0.000 |
| Plot | Mito | Lyso or Perox | ER | Golgi | PM | Cytosol | Nucleus | ||||||
| Expt B |
2 peptides |
5 spectra |
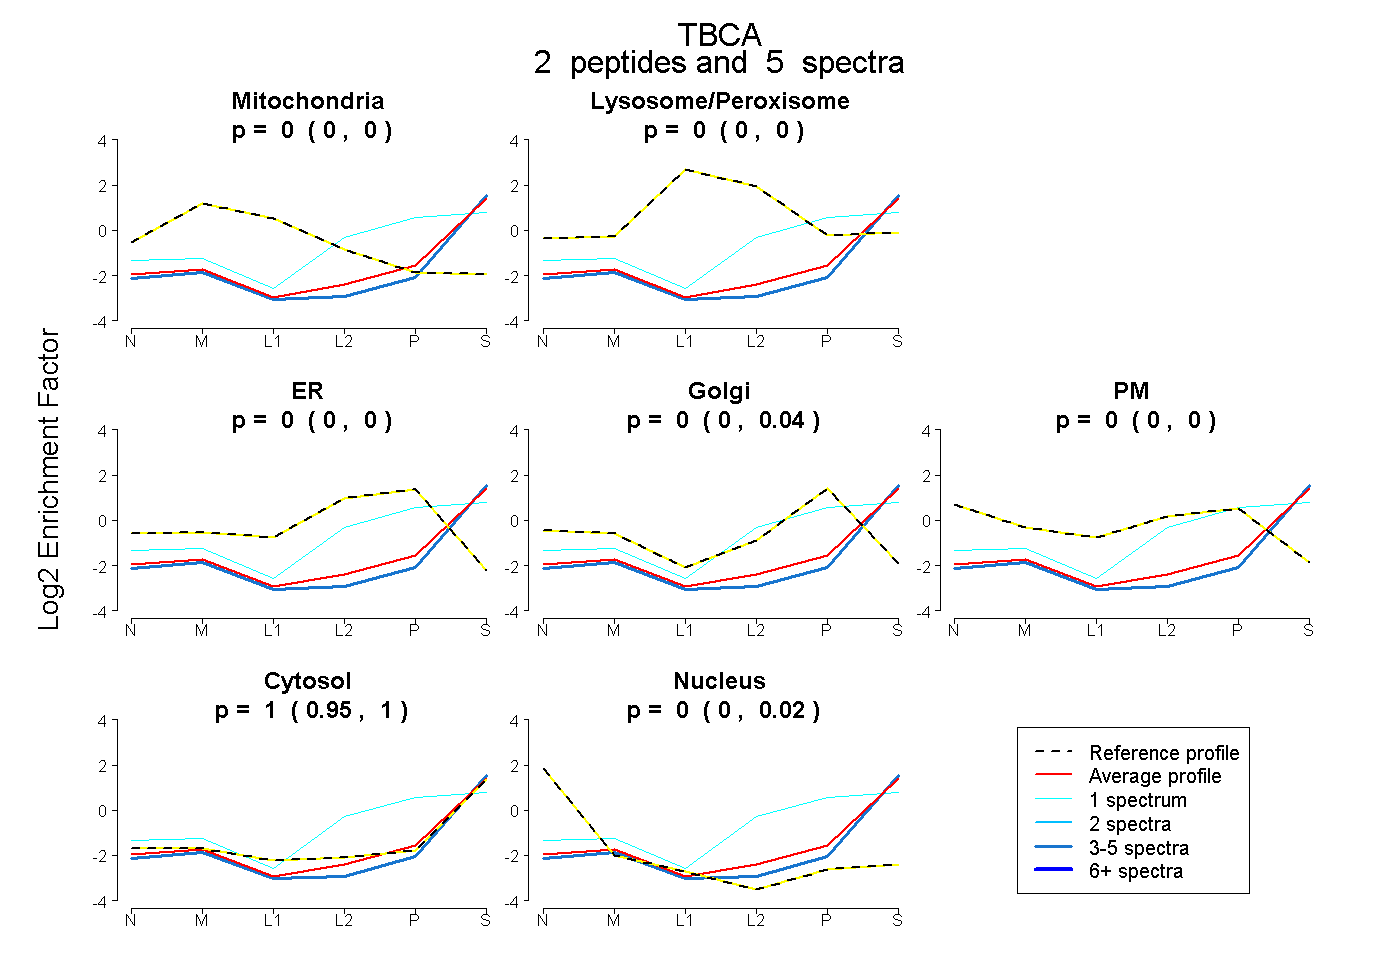 |
0.000 0.000 | 0.000 |
0.000 0.000 | 0.000 |
0.000 0.000 | 0.000 |
0.000 0.000 | 0.044 |
0.000 0.000 | 0.000 |
1.000 0.947 | 1.000 |
0.000 0.000 | 0.018 |
|||
| Plot | Lyso | Other | |||||||||||
| Expt C |
3 peptides |
12 spectra |
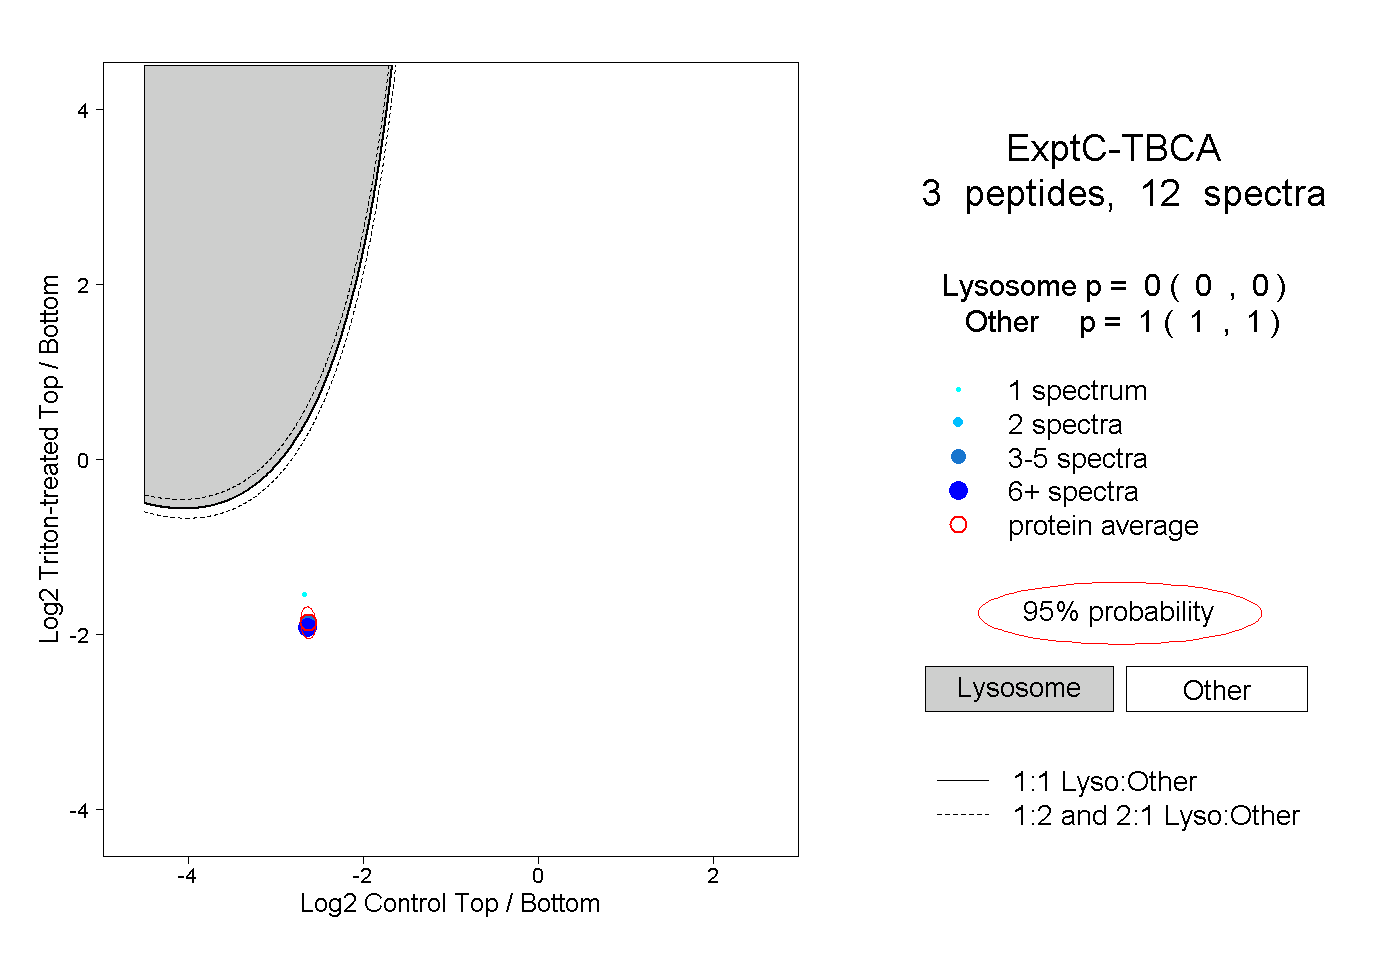 |
0.000 0.000 | 0.000 |
1.000 1.000 | 1.000 |
||||||||
| Plot | Lyso | Other | |||||||||||
| Expt D |
2 peptides |
3 spectra |
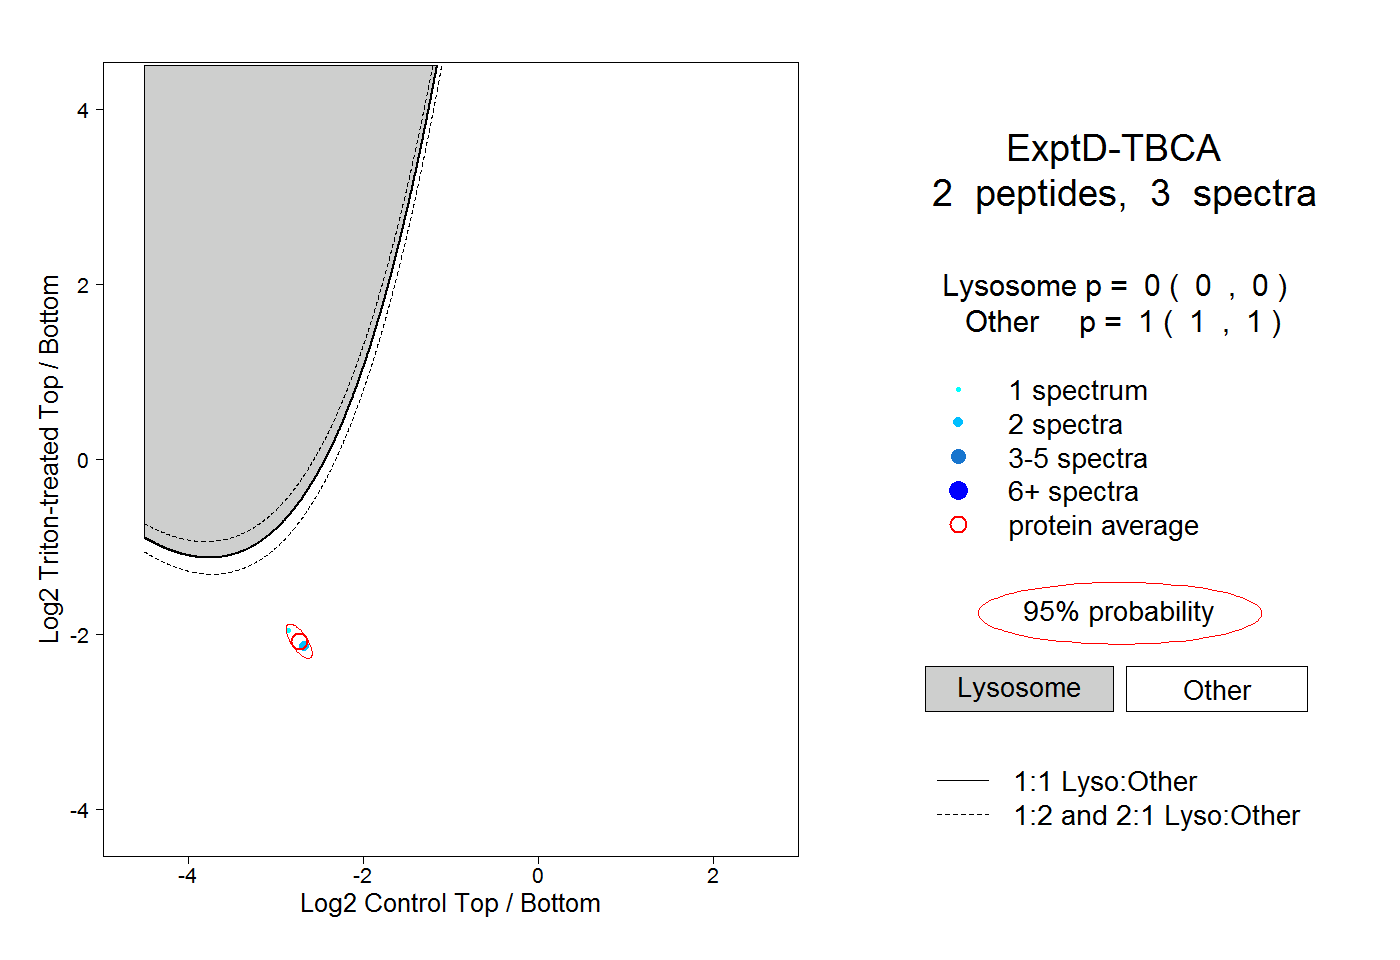 |
0.000 0.000 | 0.000 |
1.000 1.000 | 1.000 |