 7
7peptides
spectra
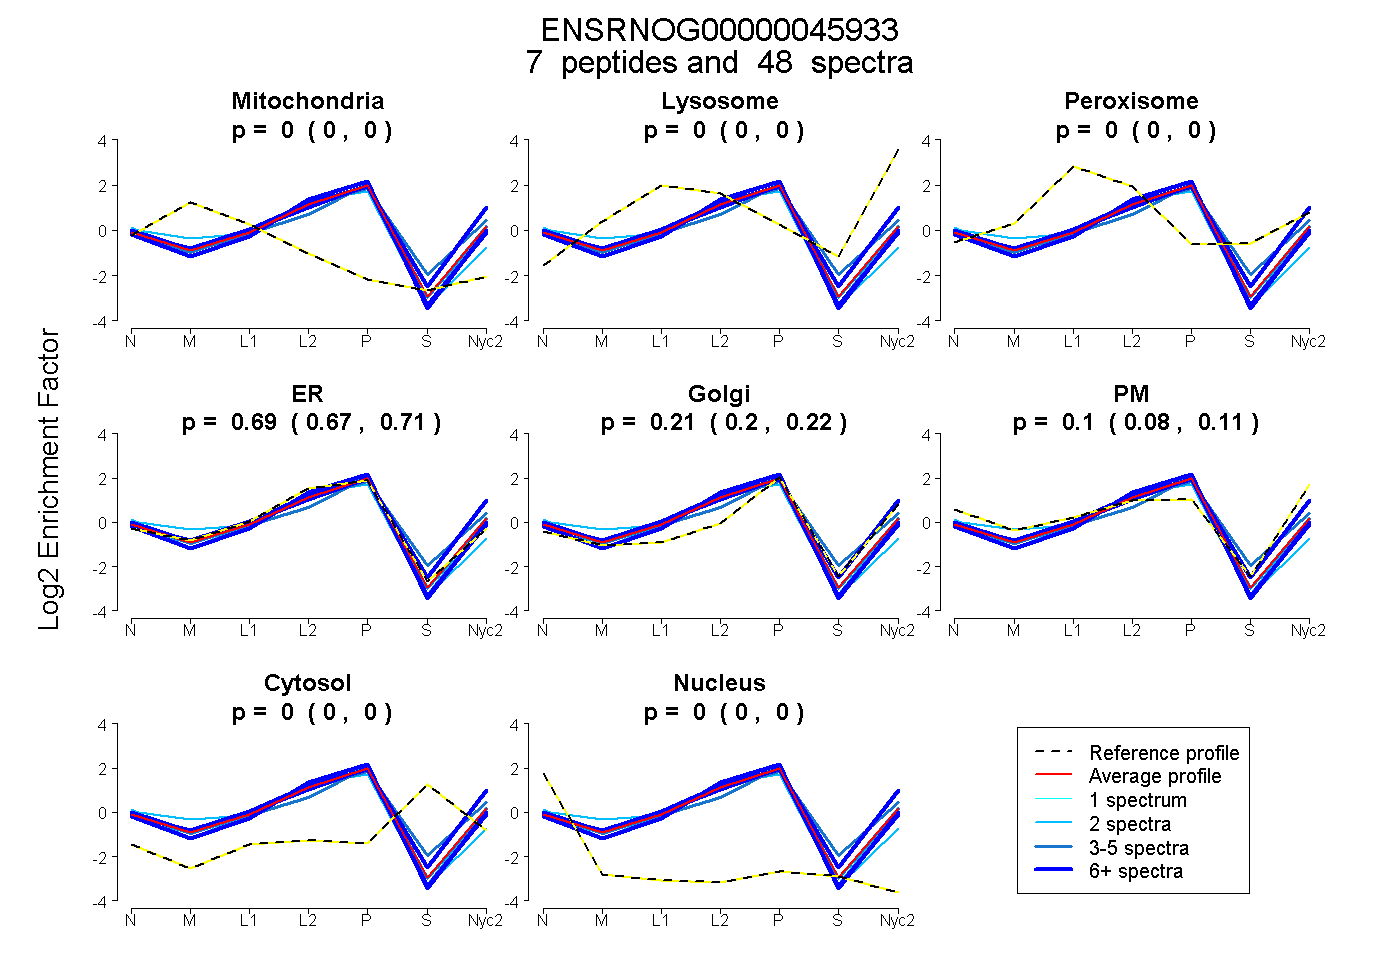
0.000 | 0.000
0.000 | 0.000
0.000 | 0.000
0.672 | 0.712
0.195 | 0.218
0.082 | 0.113
0.000 | 0.000
0.000 | 0.004
5peptides
spectra
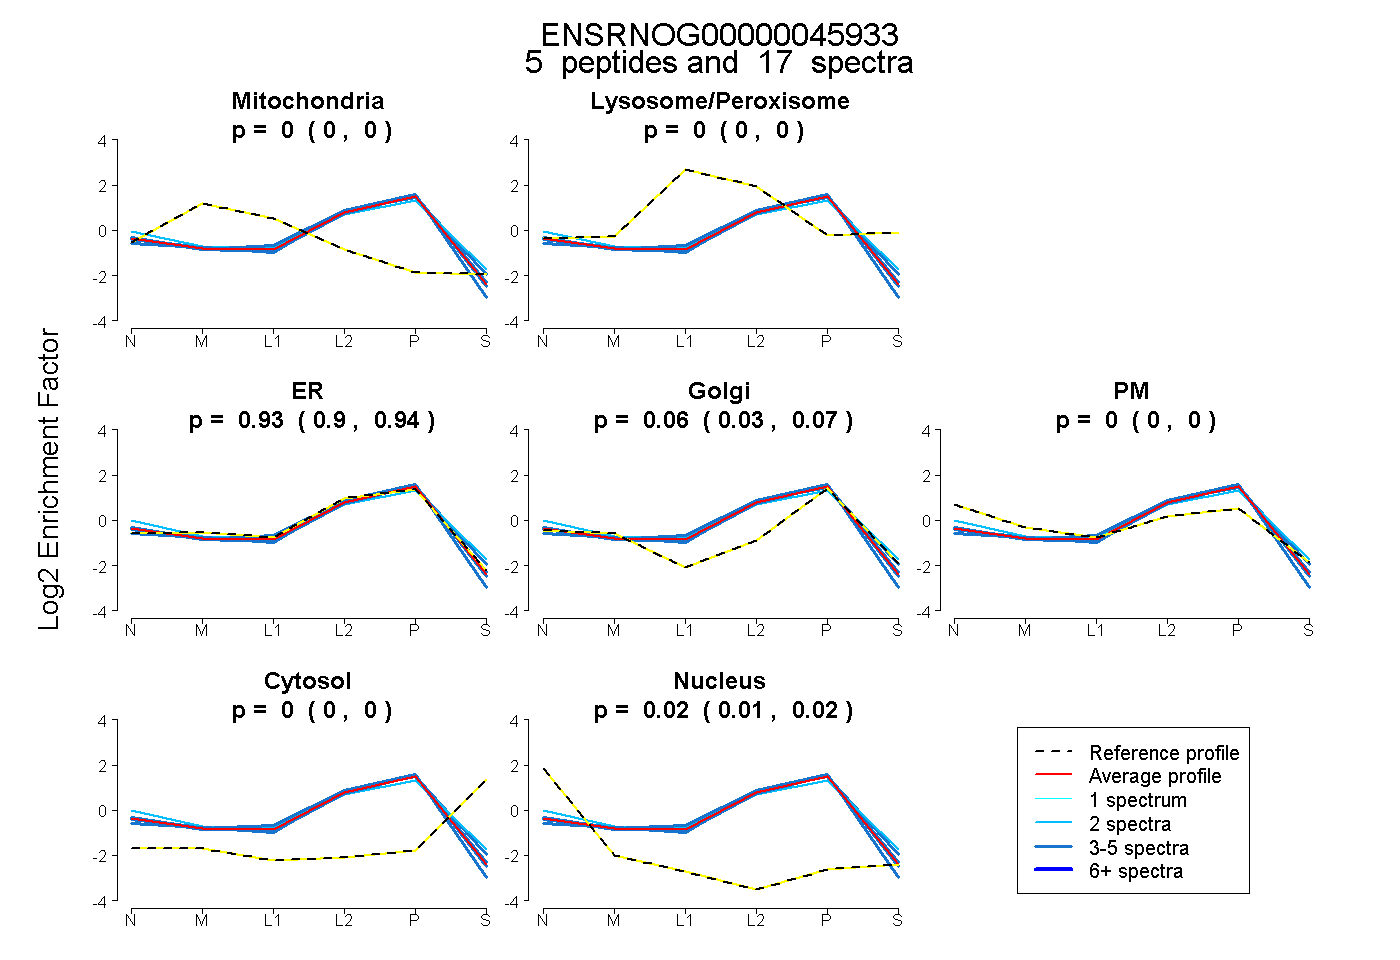
0.000 | 0.000
0.000 | 0.000
0.902 | 0.941
0.033 | 0.074
0.000 | 0.005
0.000 | 0.000
0.012 | 0.023
6peptides
spectra
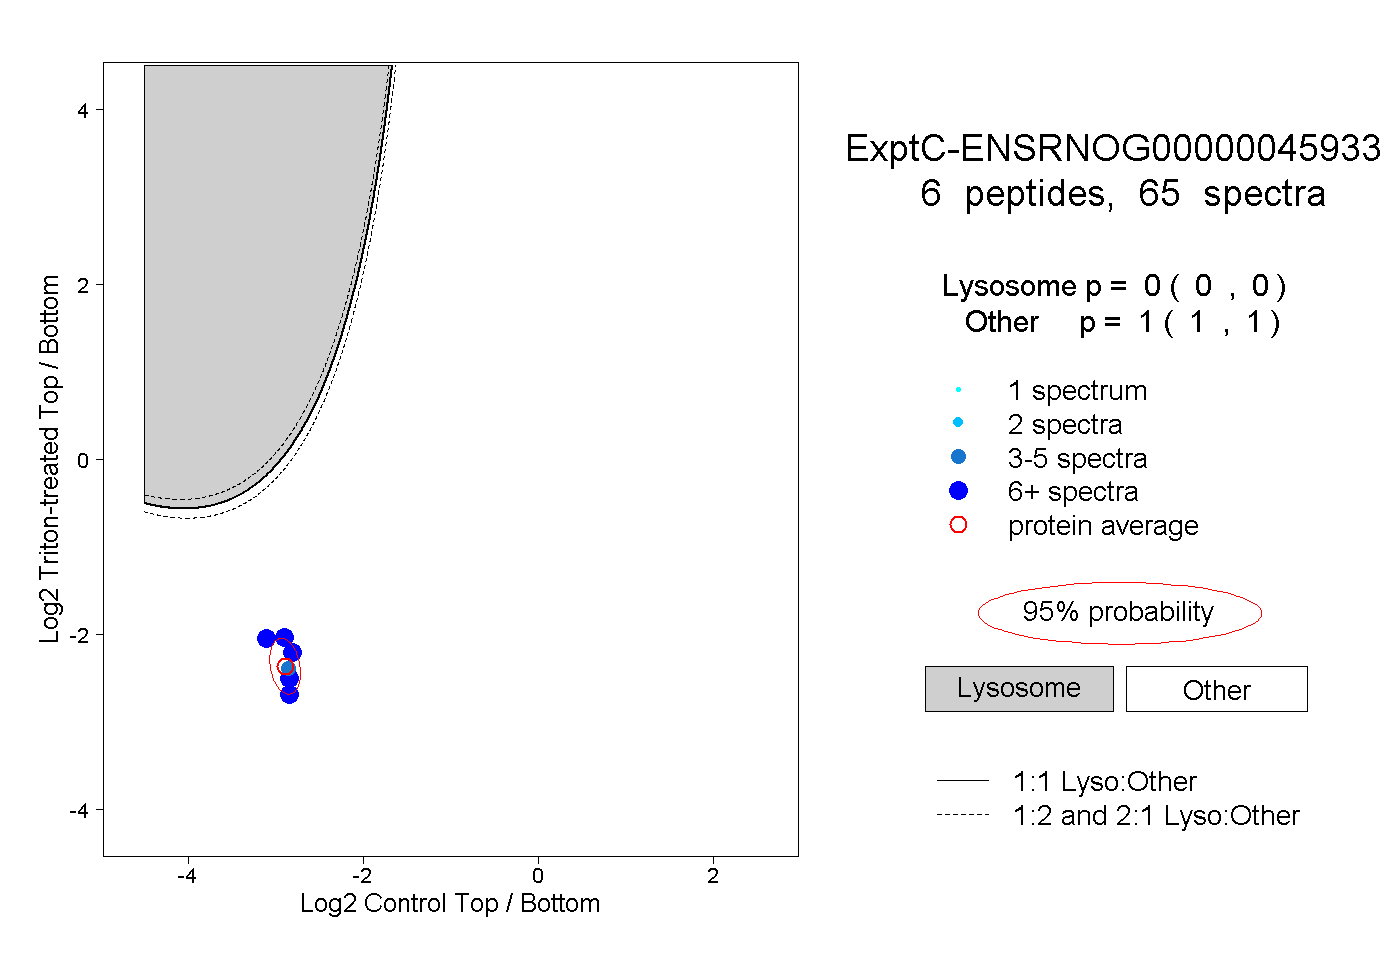
0.000 | 0.000
1.000 | 1.000
2peptides
spectra
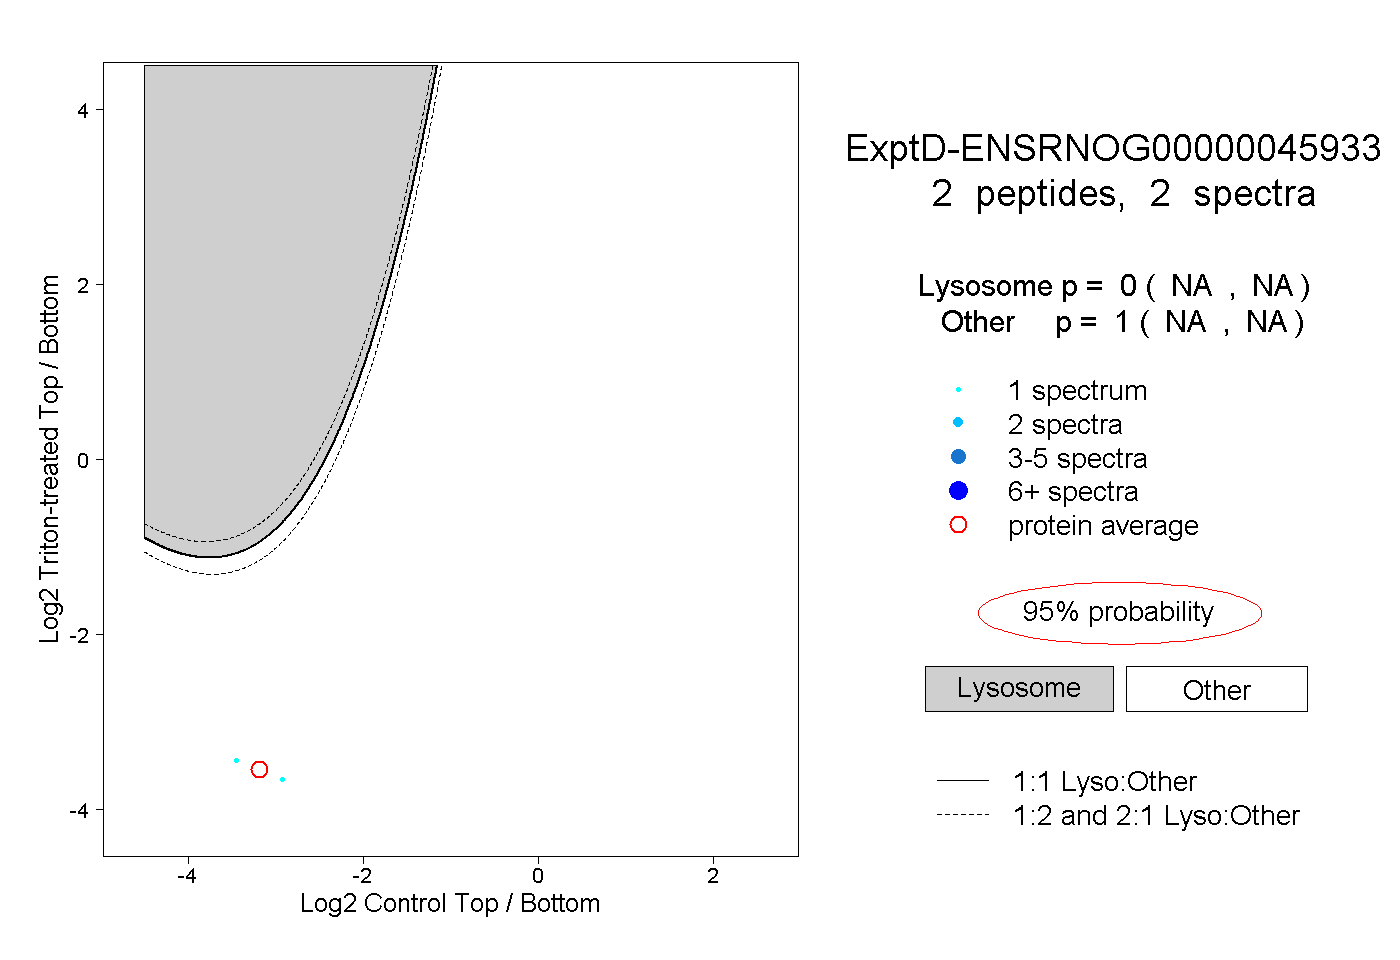
NA | NA
NA | NA