 7
7peptides
spectra
0.000 | 0.000
0.000 | 0.000
0.000 | 0.000
0.672 | 0.712
0.195 | 0.218
0.082 | 0.113
0.000 | 0.000
0.000 | 0.004
| Plot | Mito | Lyso | Perox | ER | Golgi | PM | Cytosol | Nucleus | |||||
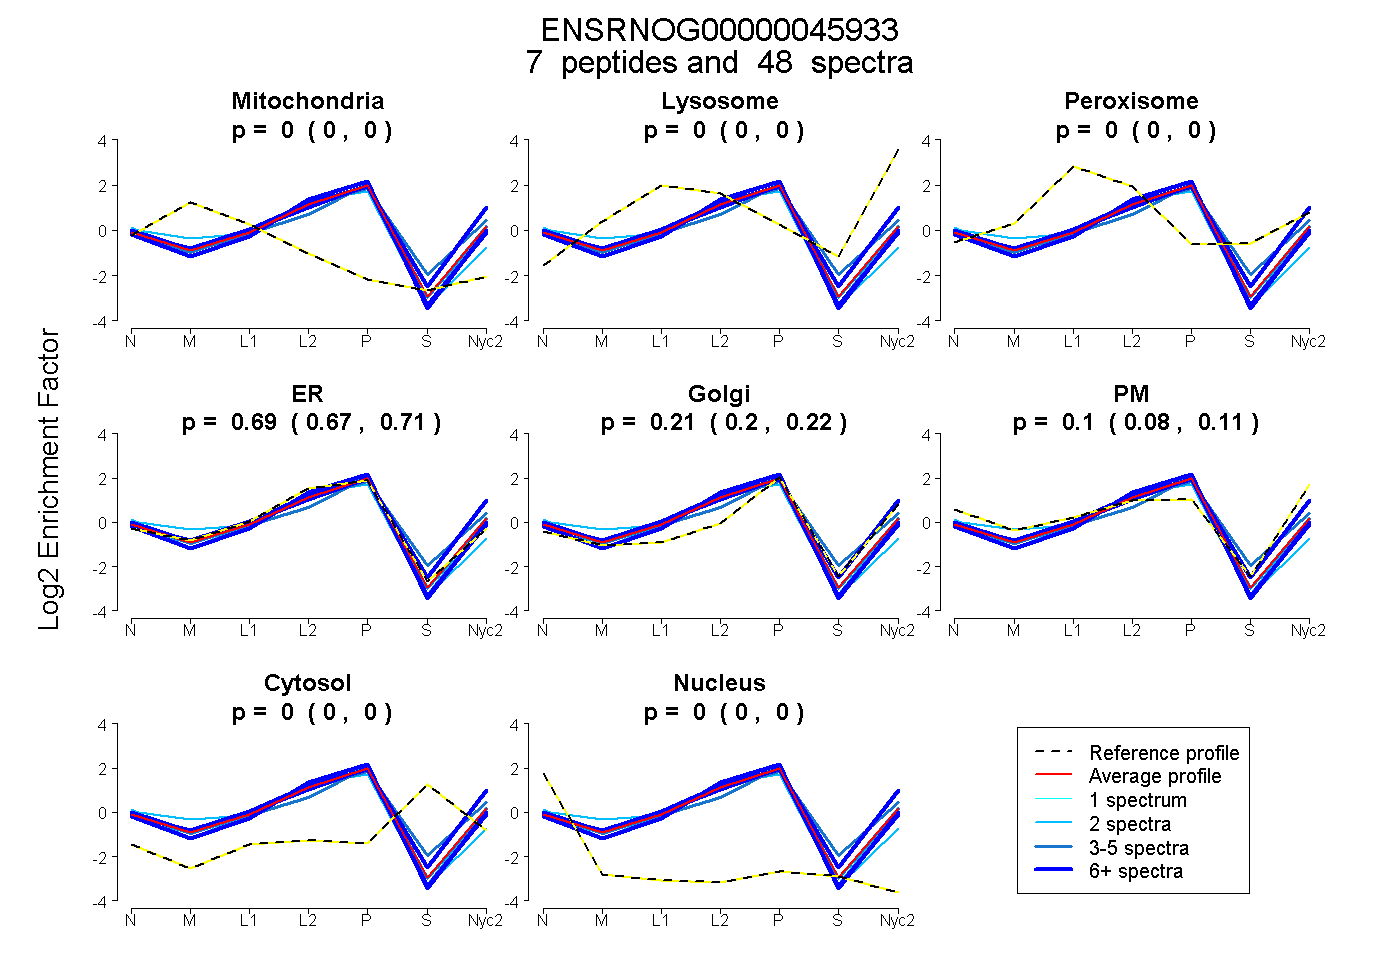
| Expt A |
7 peptides |
48 spectra |
|
0.000 0.000 | 0.000 |
0.000 0.000 | 0.000 |
0.000 0.000 | 0.000 |
0.693 0.672 | 0.712 |
0.209 0.195 | 0.218 |
0.097 0.082 | 0.113 |
0.000 0.000 | 0.000 |
0.000 0.000 | 0.004 |
| 2 spectra, EPPSGR | 0.000 | 0.000 | 0.000 | 0.685 | 0.186 | 0.115 | 0.000 | 0.014 | ||
| 11 spectra, VLDLFSR | 0.000 | 0.000 | 0.000 | 0.827 | 0.173 | 0.000 | 0.000 | 0.000 | ||
| 5 spectra, QLQLFR | 0.000 | 0.024 | 0.000 | 0.544 | 0.189 | 0.185 | 0.058 | 0.000 | ||
| 8 spectra, SDLADITK | 0.000 | 0.000 | 0.000 | 0.787 | 0.140 | 0.053 | 0.000 | 0.021 | ||
| 2 spectra, APYHIR | 0.079 | 0.000 | 0.000 | 0.900 | 0.000 | 0.000 | 0.000 | 0.021 | ||
| 17 spectra, TVLQFAR | 0.000 | 0.077 | 0.000 | 0.428 | 0.239 | 0.256 | 0.000 | 0.000 | ||
| 3 spectra, GQGIAK | 0.012 | 0.000 | 0.000 | 0.566 | 0.396 | 0.026 | 0.000 | 0.000 |
| Plot | Mito | Lyso or Perox | ER | Golgi | PM | Cytosol | Nucleus | ||||||
| Expt B |
5 peptides |
17 spectra |
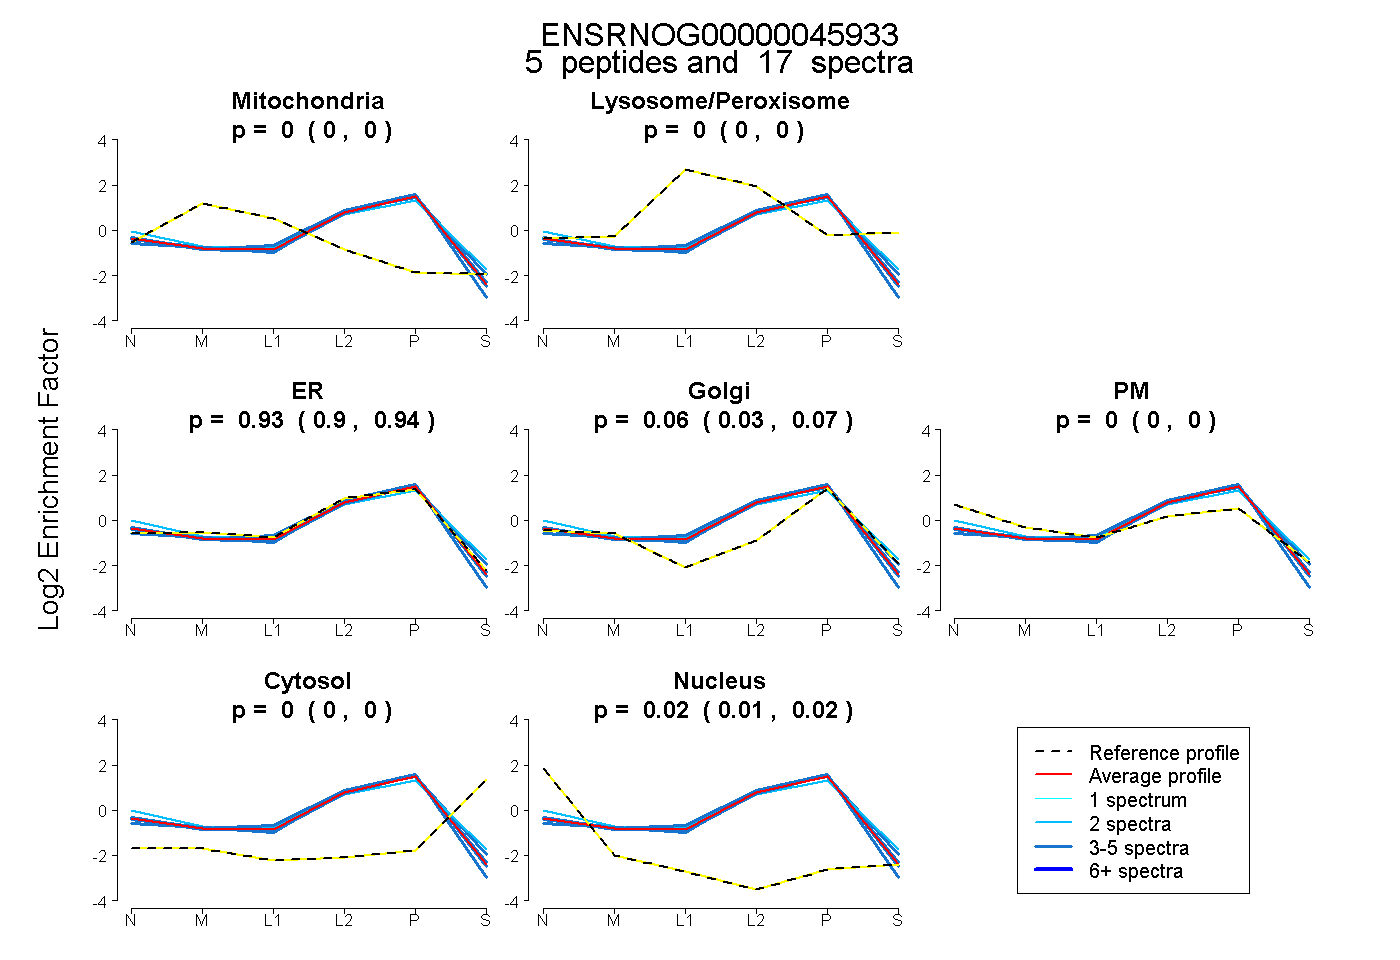 |
0.000 0.000 | 0.000 |
0.000 0.000 | 0.000 |
0.926 0.902 | 0.941 |
0.055 0.033 | 0.074 |
0.000 0.000 | 0.005 |
0.000 0.000 | 0.000 |
0.019 0.012 | 0.023 |
|||
| Plot | Lyso | Other | |||||||||||
| Expt C |
6 peptides |
65 spectra |
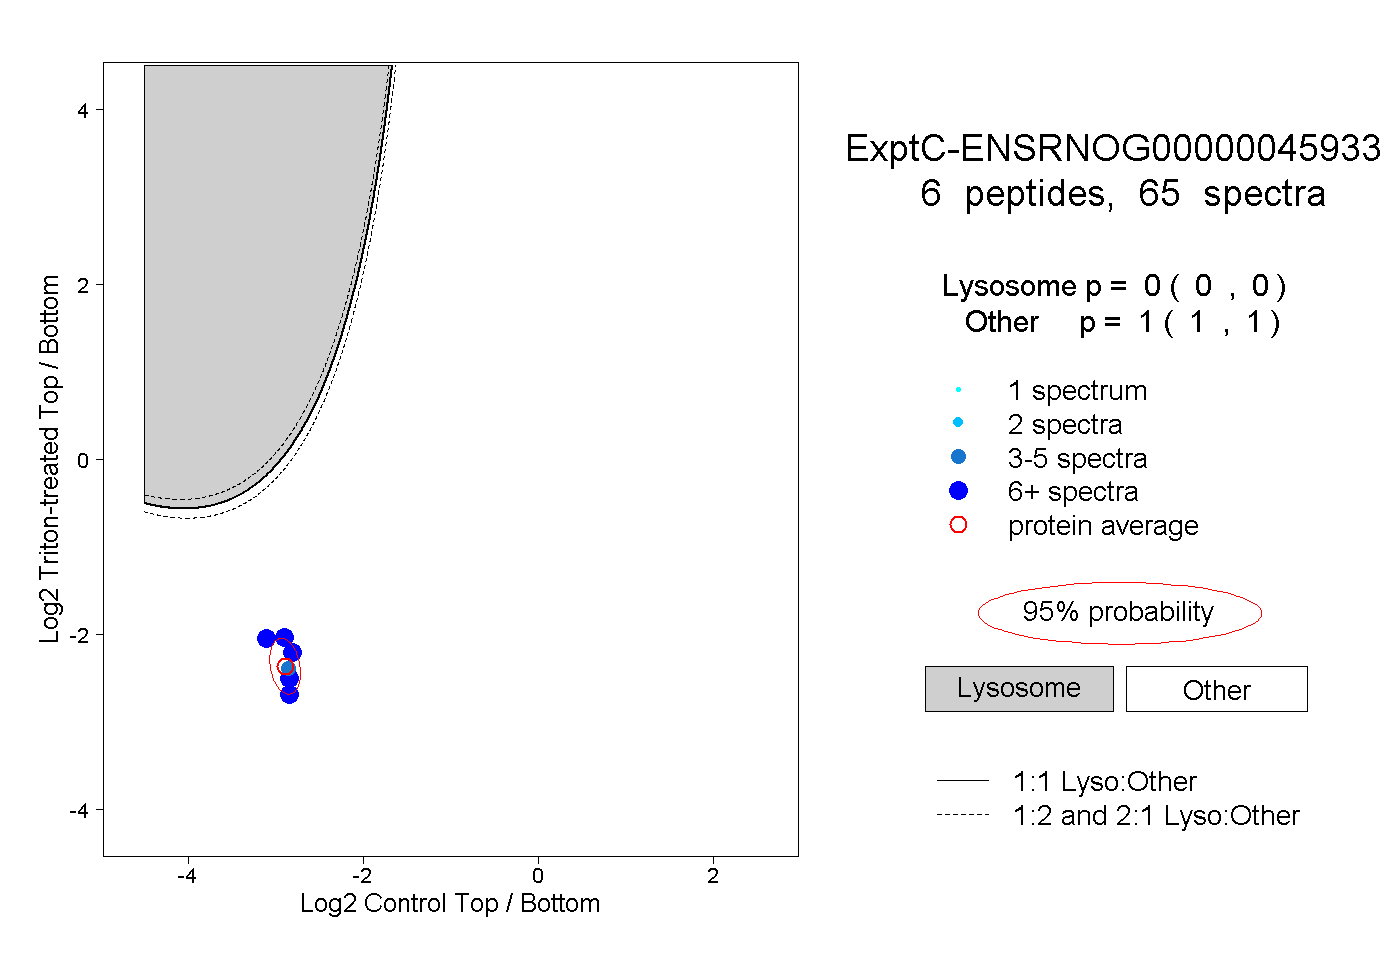 |
0.000 0.000 | 0.000 |
1.000 1.000 | 1.000 |
||||||||
| Plot | Lyso | Other | |||||||||||
| Expt D |
2 peptides |
2 spectra |
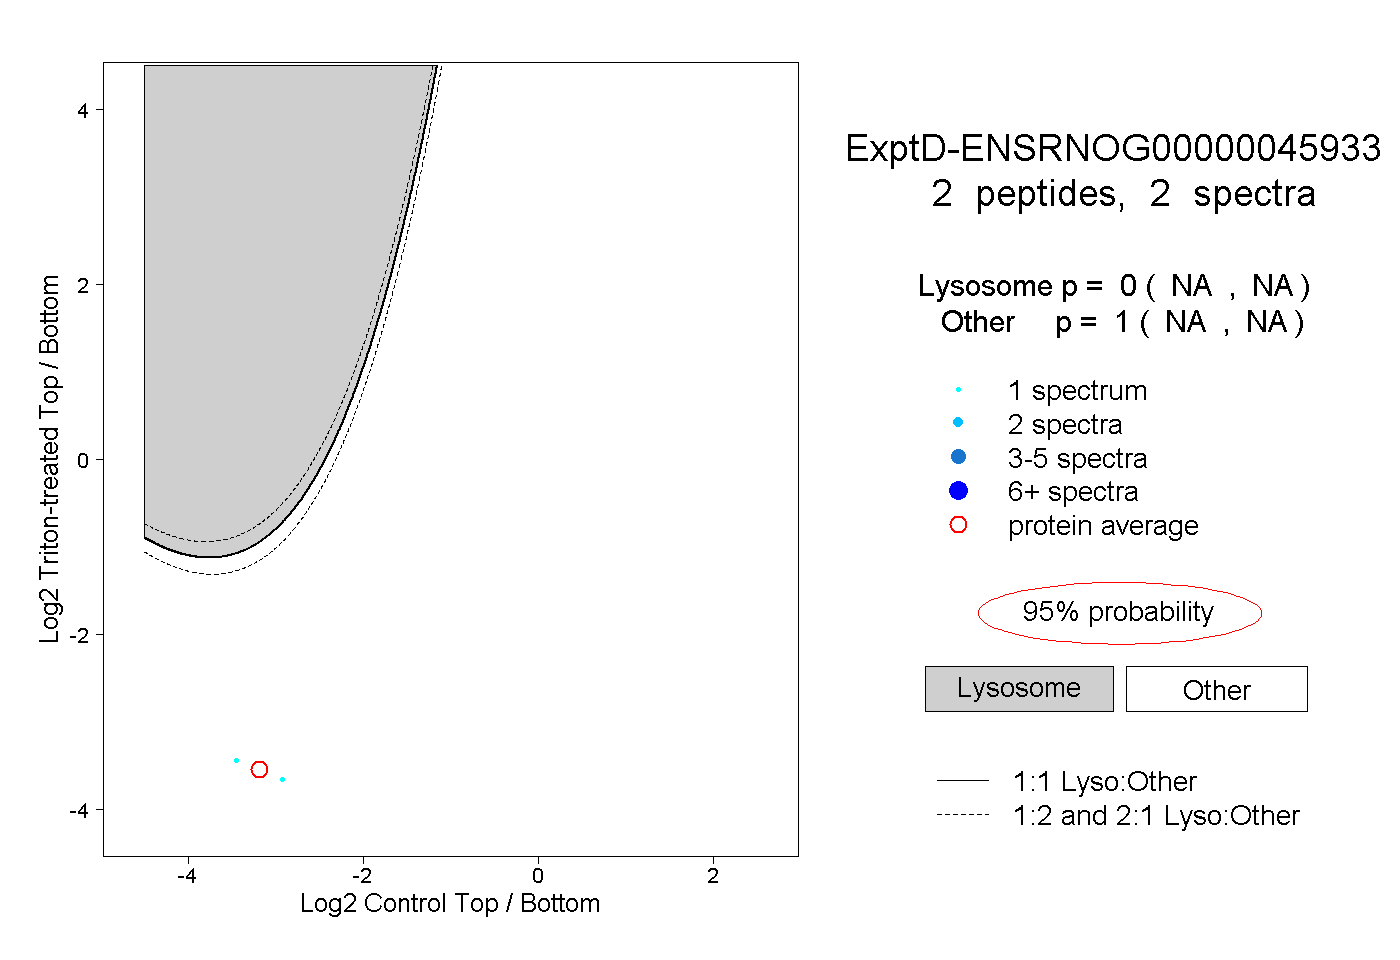 |
0.000 NA | NA |
1.000 NA | NA |