 5
5peptides
spectra
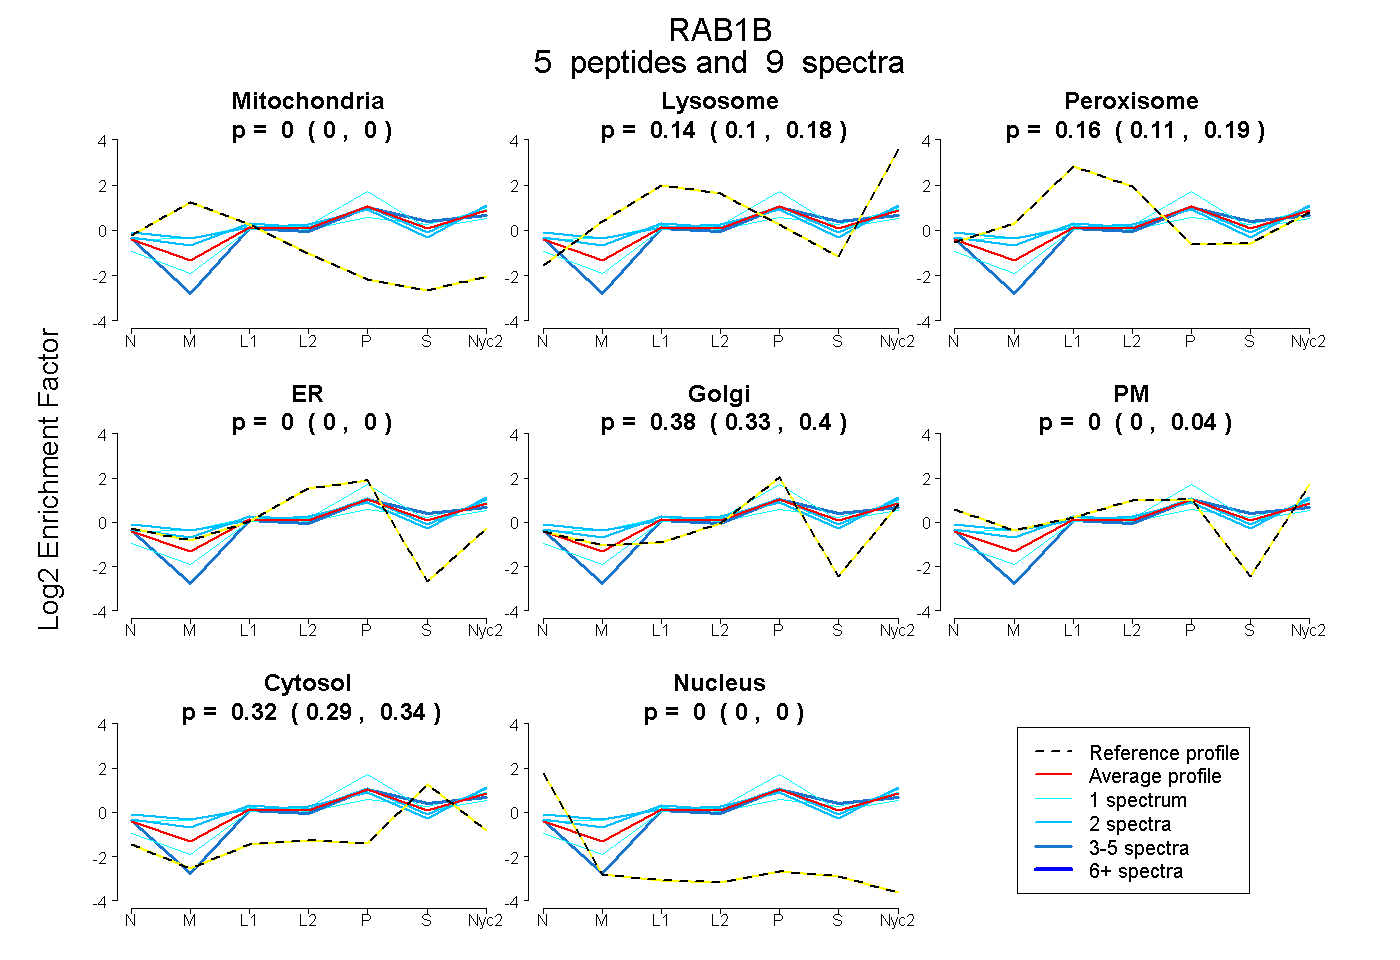
0.000 | 0.000
0.101 | 0.175
0.113 | 0.193
0.000 | 0.000
0.333 | 0.402
0.000 | 0.038
0.289 | 0.342
0.000 | 0.000
4peptides
spectra
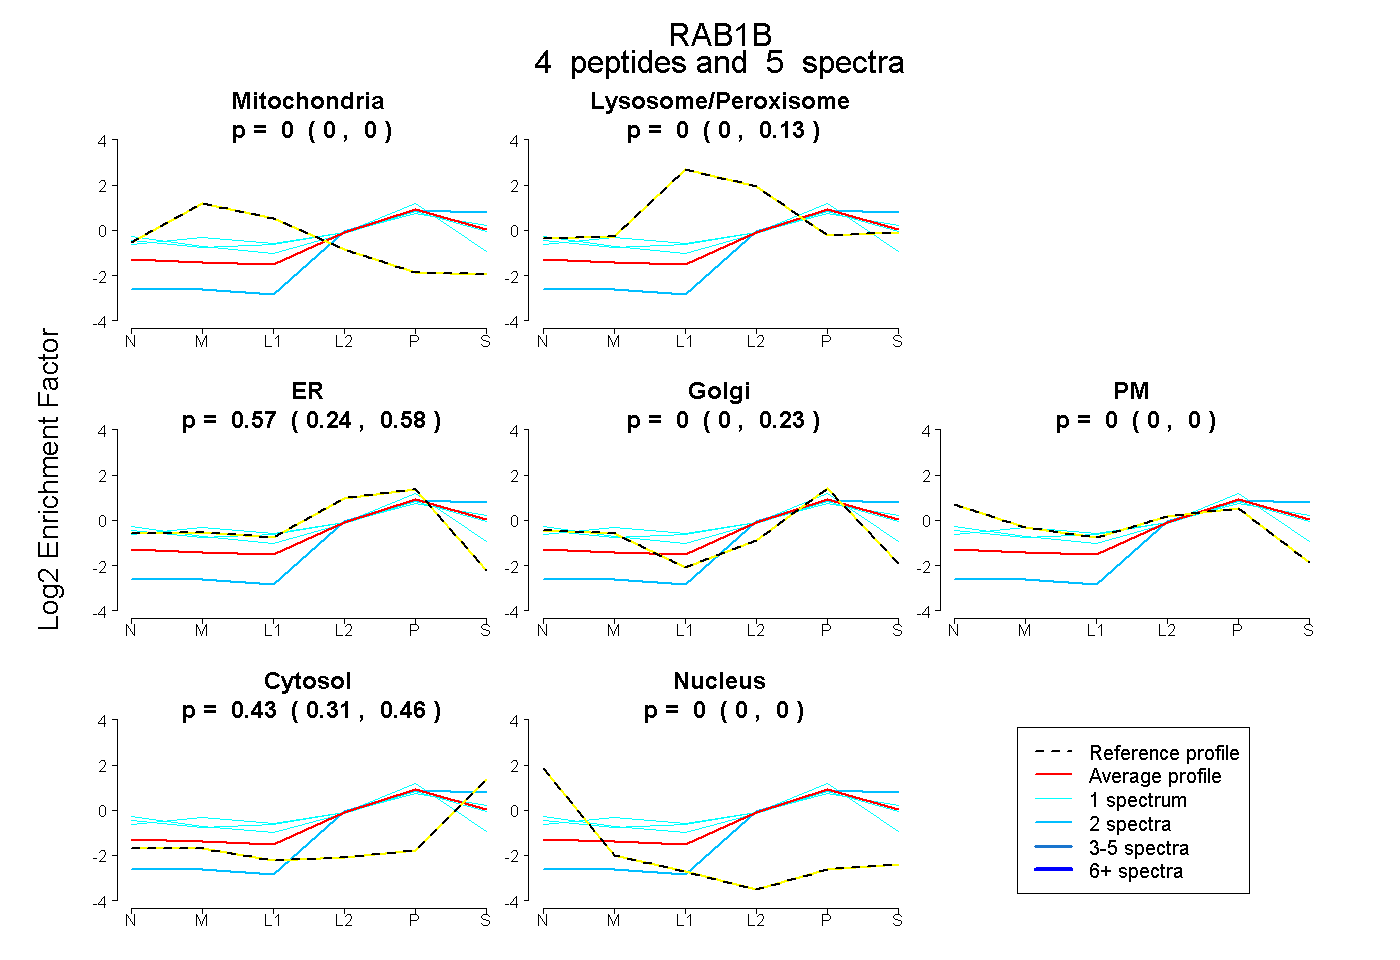
0.000 | 0.000
0.000 | 0.133
0.238 | 0.581
0.000 | 0.232
0.000 | 0.000
0.313 | 0.464
0.000 | 0.000
4peptides
spectra
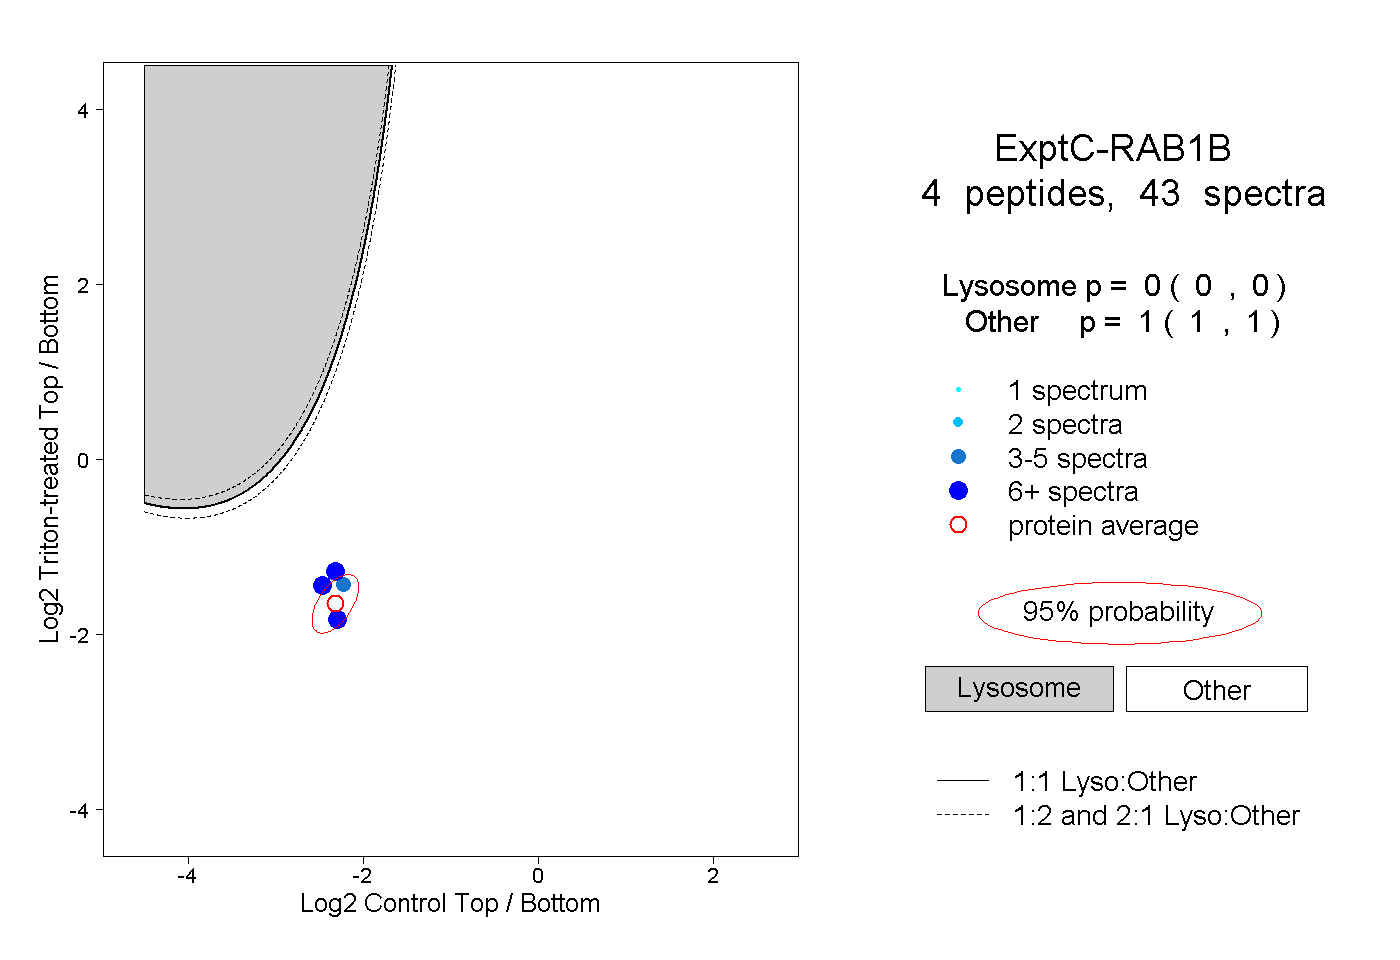
0.000 | 0.000
1.000 | 1.000
1peptide
spectrum
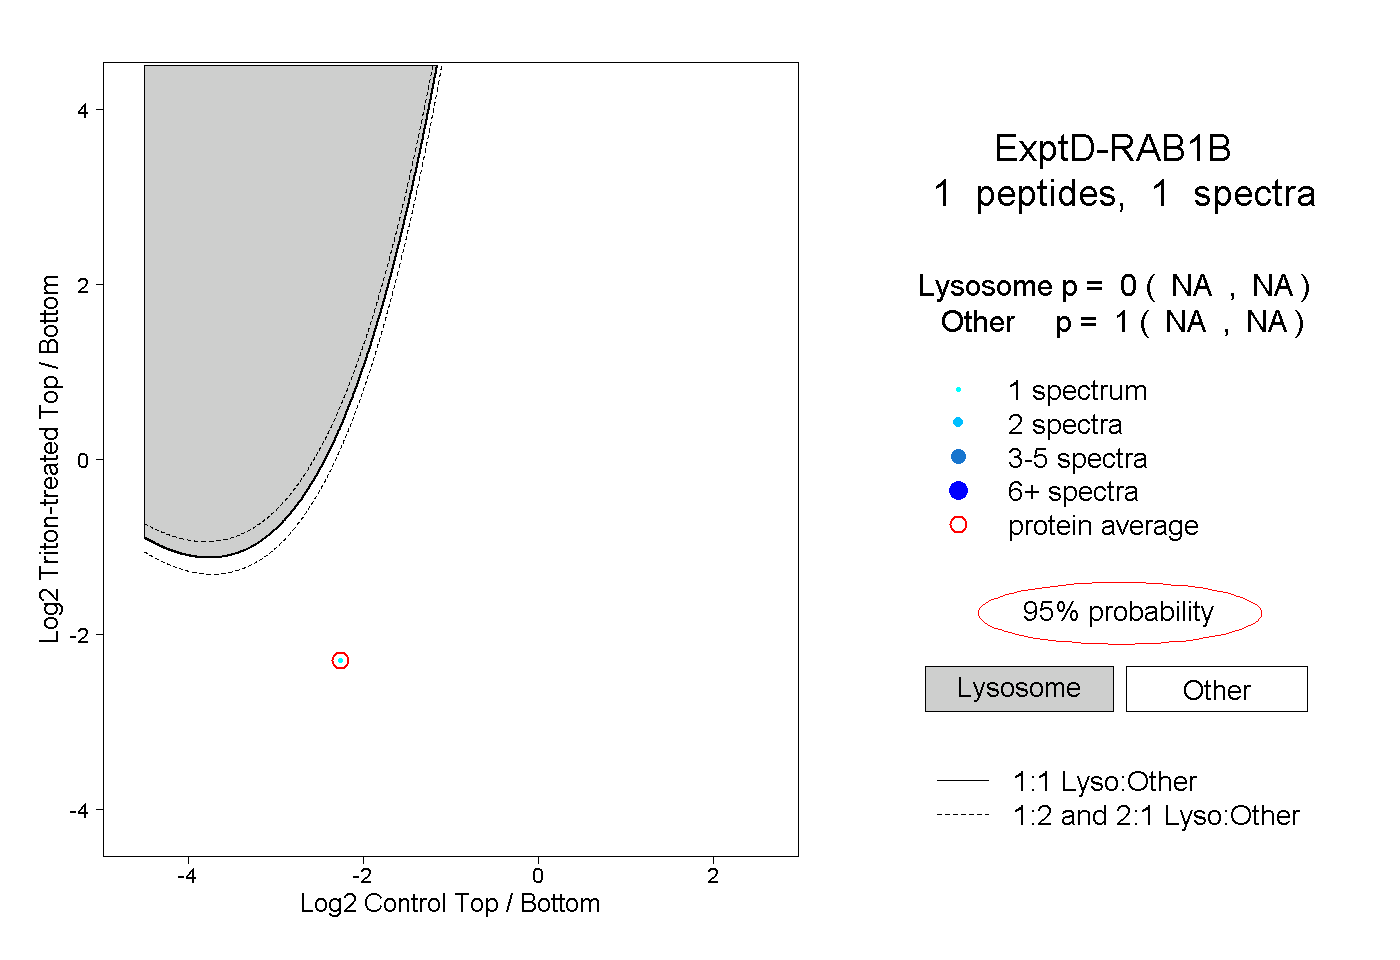
NA | NA
NA | NA