 5
5peptides
spectra
0.000 | 0.000
0.101 | 0.175
0.113 | 0.193
0.000 | 0.000
0.333 | 0.402
0.000 | 0.038
0.289 | 0.342
0.000 | 0.000
| Plot | Mito | Lyso | Perox | ER | Golgi | PM | Cytosol | Nucleus | |||||
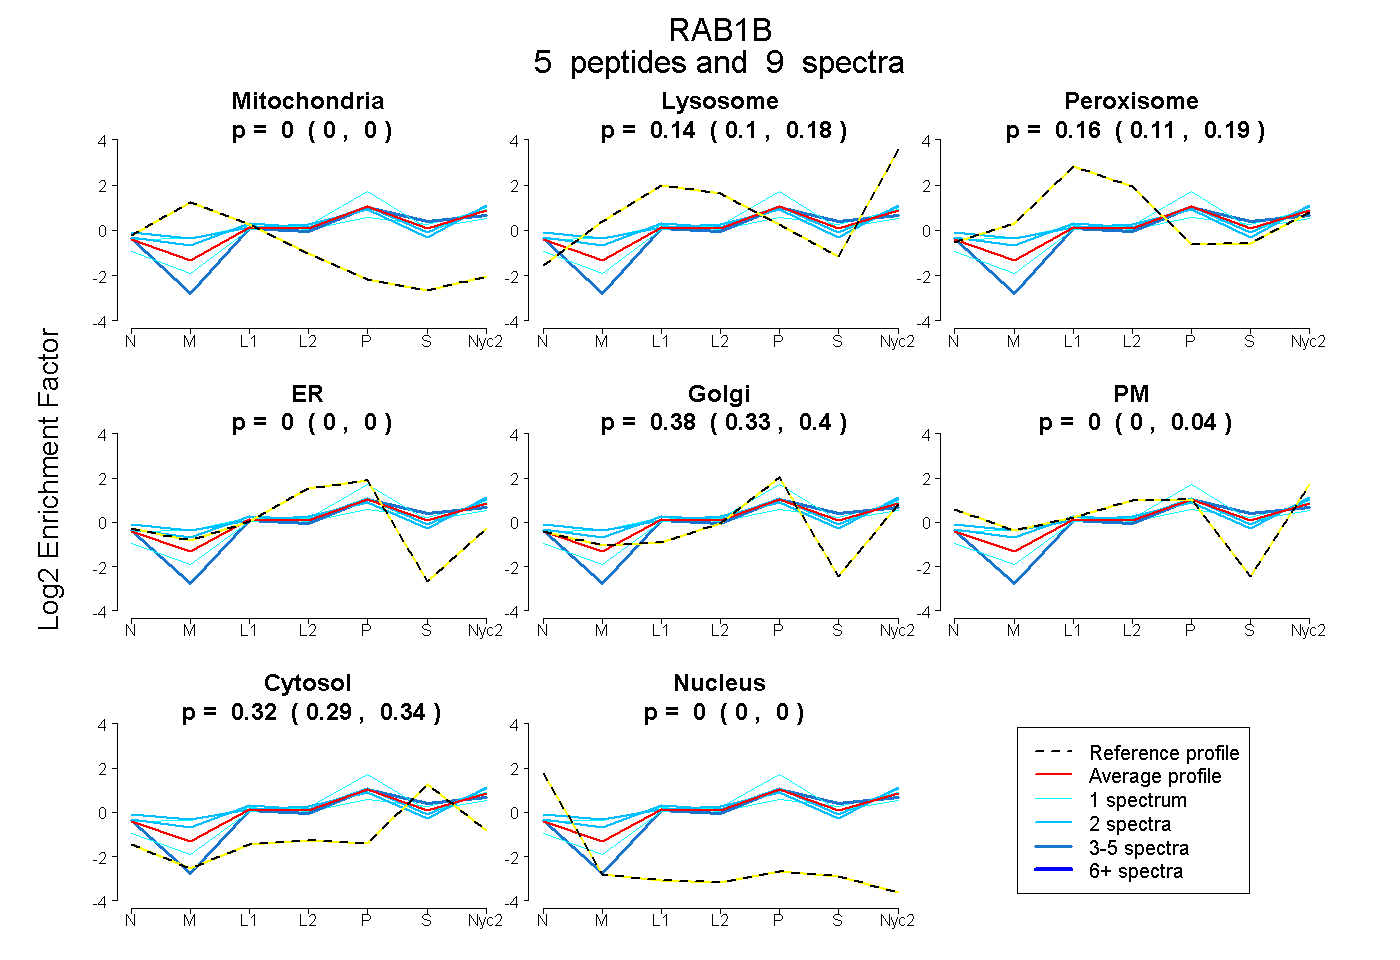
| Expt A |
5 peptides |
9 spectra |
|
0.000 0.000 | 0.000 |
0.142 0.101 | 0.175 |
0.159 0.113 | 0.193 |
0.000 0.000 | 0.000 |
0.383 0.333 | 0.402 |
0.000 0.000 | 0.038 |
0.316 0.289 | 0.342 |
0.000 0.000 | 0.000 |
| 2 spectra, NATNVEQAFMTMAAEIK | 0.000 | 0.135 | 0.138 | 0.000 | 0.209 | 0.278 | 0.240 | 0.000 | ||
| 2 spectra, IDSTPVK | 0.000 | 0.173 | 0.185 | 0.000 | 0.378 | 0.022 | 0.242 | 0.000 | ||
| 1 spectrum, EFADSLGVPFLETSAK | 0.000 | 0.178 | 0.200 | 0.000 | 0.222 | 0.070 | 0.331 | 0.000 | ||
| 1 spectrum, MGPGAASGGERPNLK | 0.000 | 0.168 | 0.000 | 0.190 | 0.283 | 0.000 | 0.359 | 0.000 | ||
| 3 spectra, FADDTYTESYISTIGVDFK | 0.000 | 0.092 | 0.084 | 0.017 | 0.333 | 0.013 | 0.460 | 0.000 |
| Plot | Mito | Lyso or Perox | ER | Golgi | PM | Cytosol | Nucleus | ||||||
| Expt B |
4 peptides |
5 spectra |
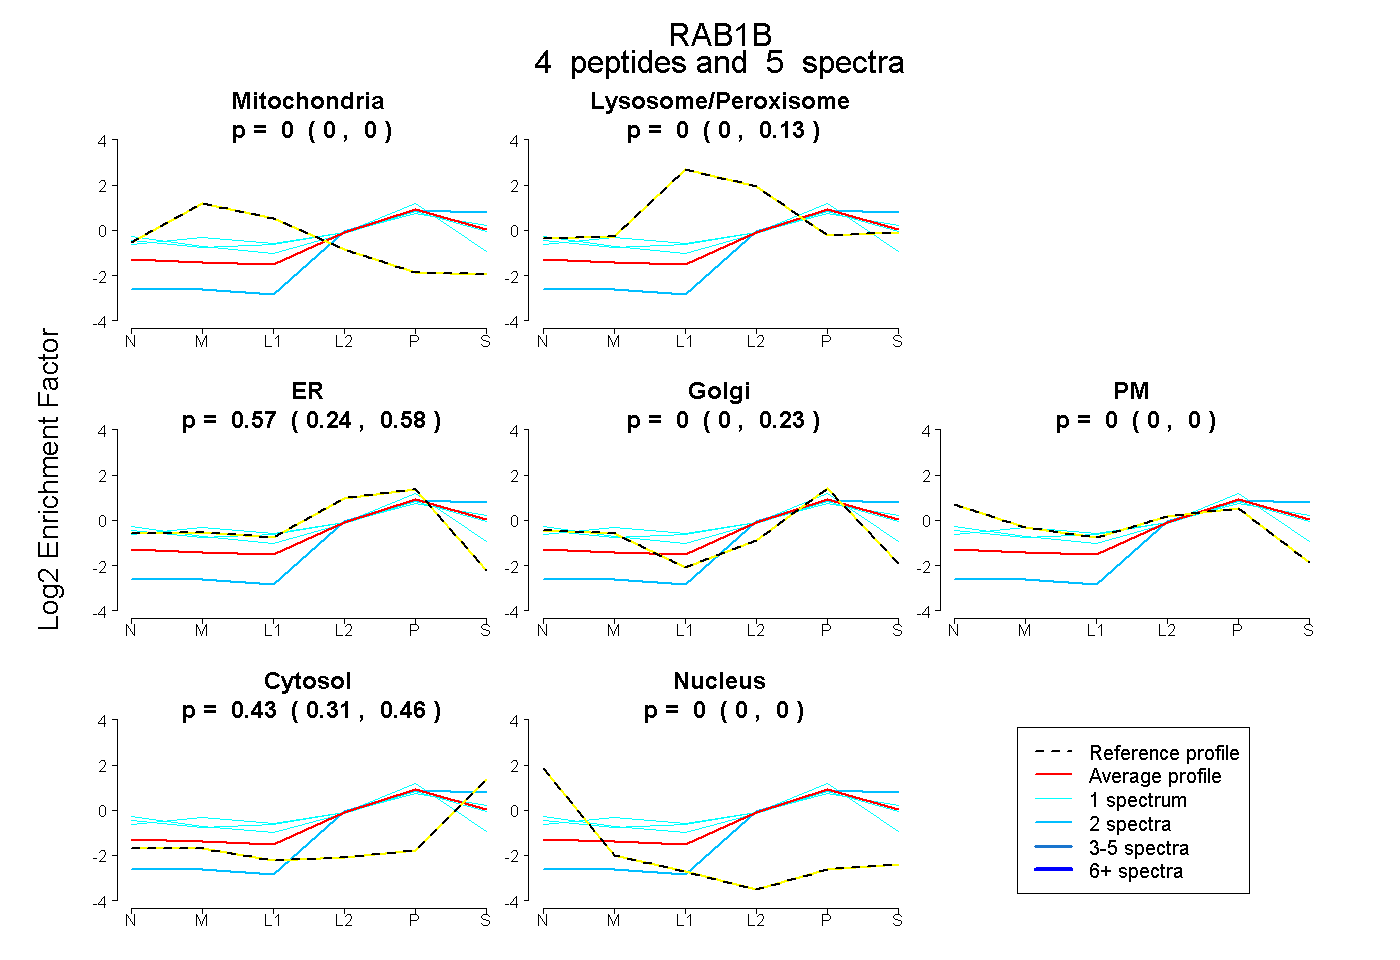 |
0.000 0.000 | 0.000 |
0.000 0.000 | 0.133 |
0.572 0.238 | 0.581 |
0.000 0.000 | 0.232 |
0.000 0.000 | 0.000 |
0.428 0.313 | 0.464 |
0.000 0.000 | 0.000 |
|||
| Plot | Lyso | Other | |||||||||||
| Expt C |
4 peptides |
43 spectra |
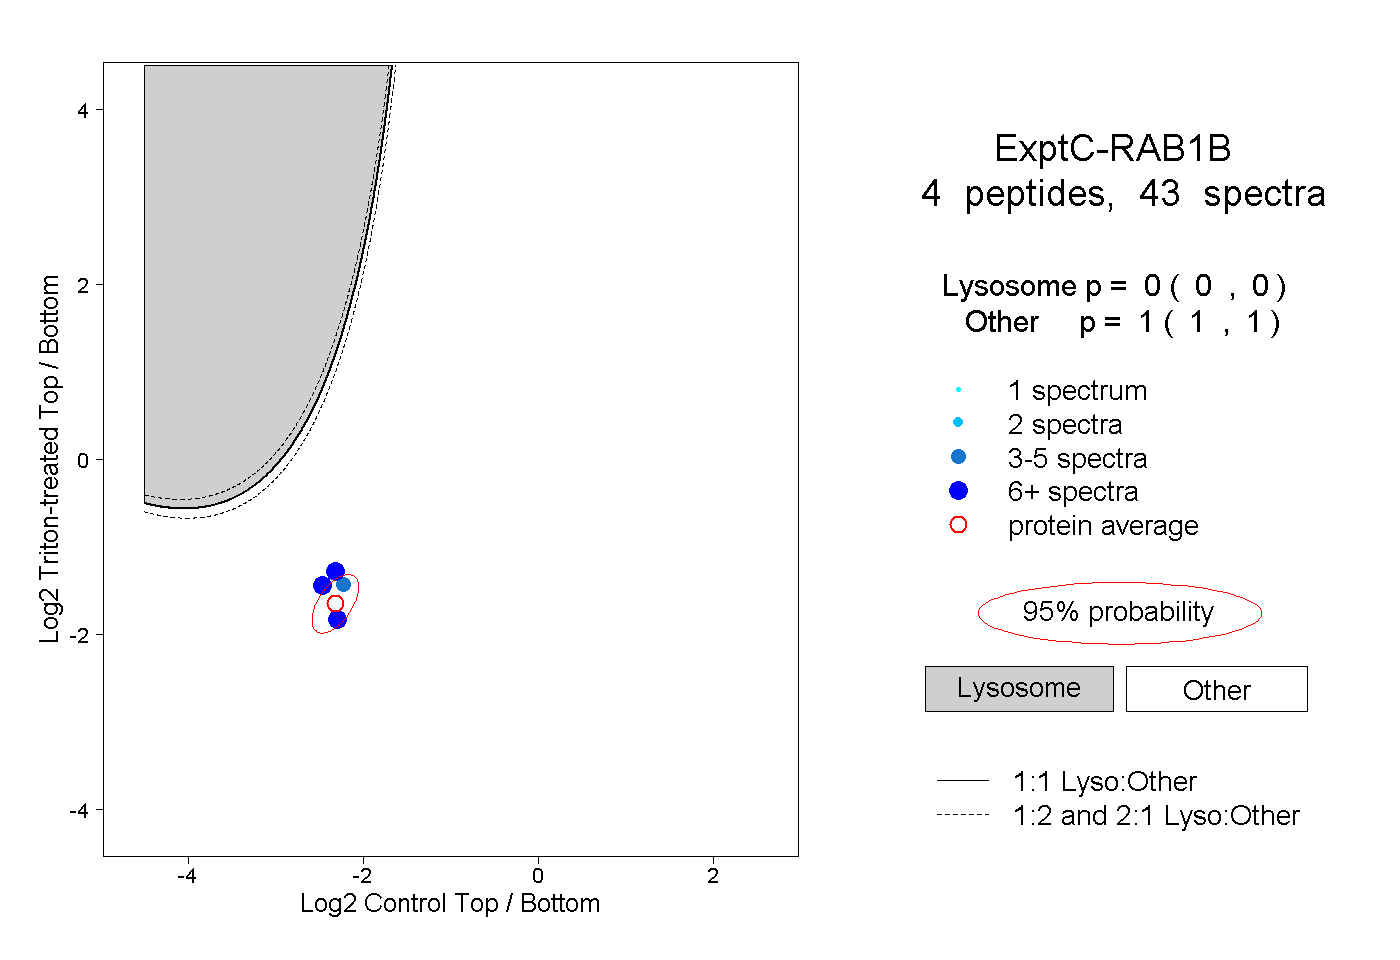 |
0.000 0.000 | 0.000 |
1.000 1.000 | 1.000 |
||||||||
| Plot | Lyso | Other | |||||||||||
| Expt D |
1 peptide |
1 spectrum |
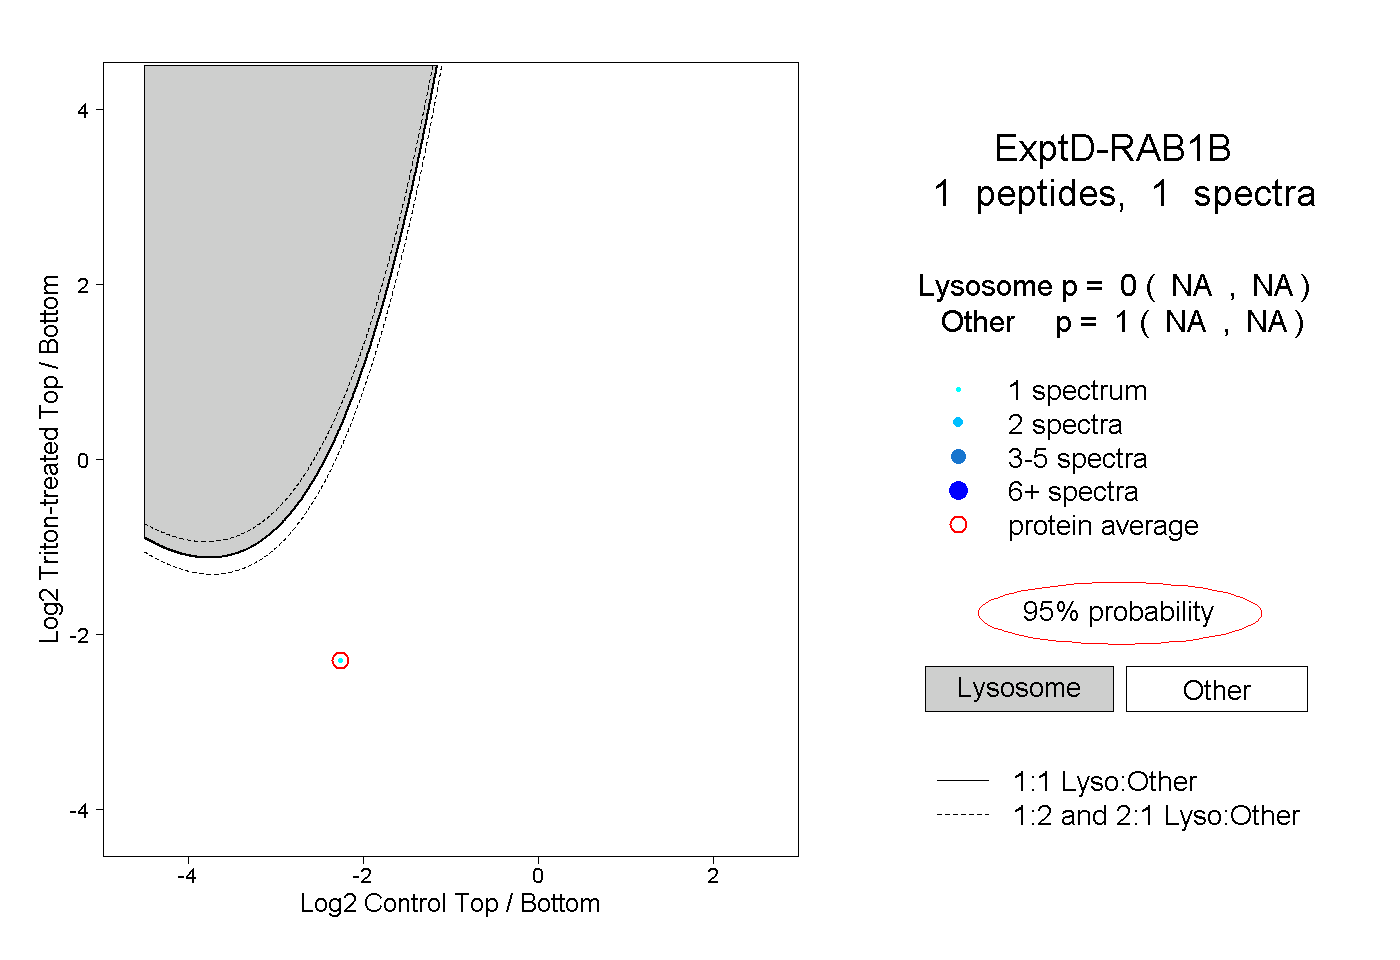 |
0.000 NA | NA |
1.000 NA | NA |