 5
5peptides
spectra
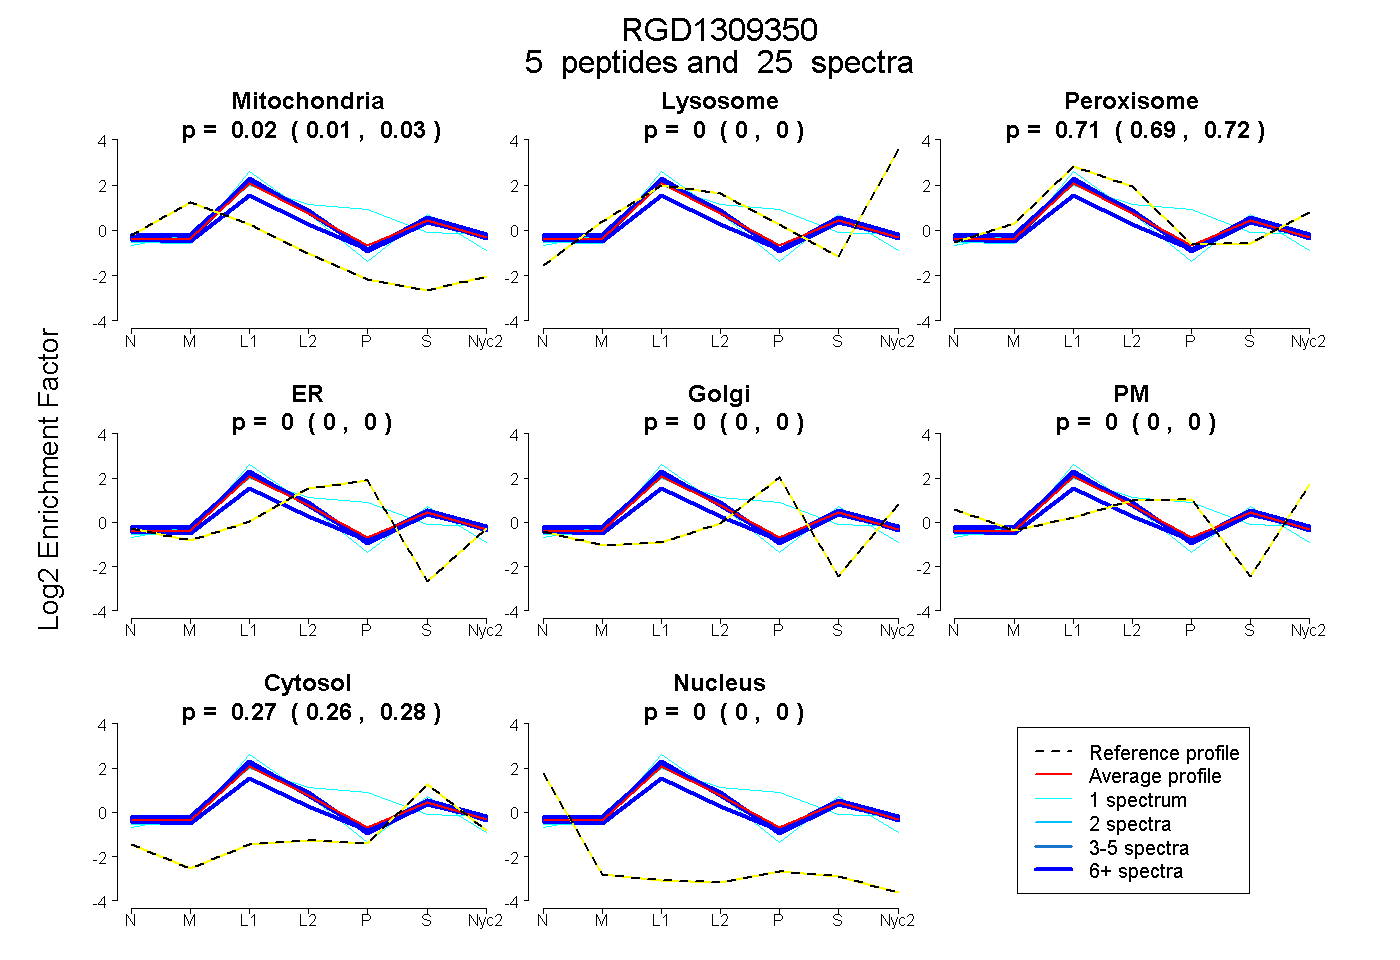
0.007 | 0.028
0.000 | 0.000
0.694 | 0.720
0.000 | 0.000
0.000 | 0.000
0.000 | 0.000
0.263 | 0.278
0.000 | 0.005
3peptides
spectra
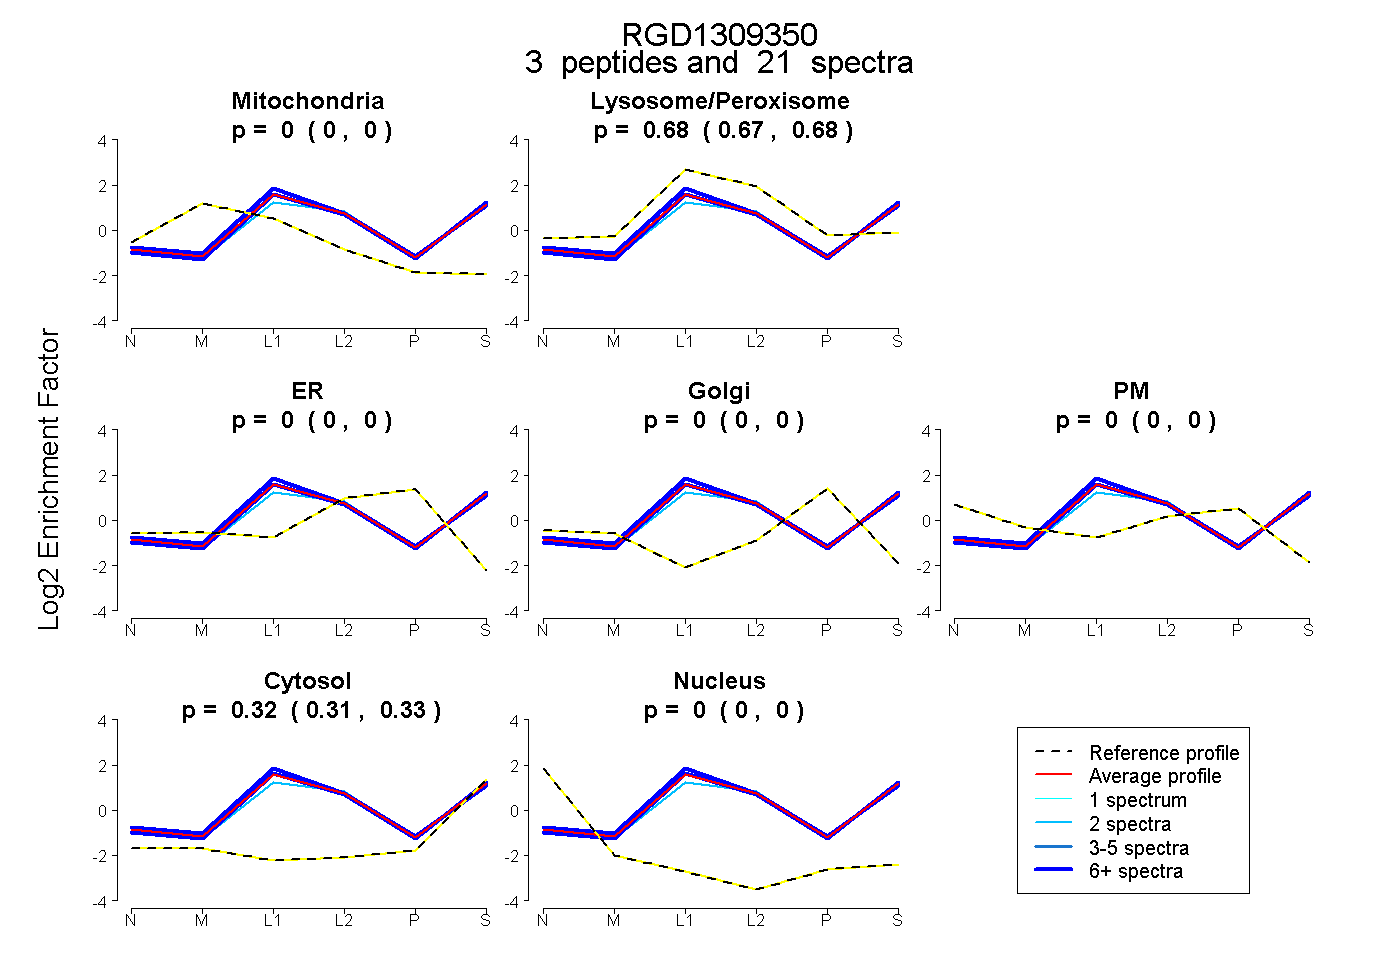
0.000 | 0.000
0.672 | 0.684
0.000 | 0.000
0.000 | 0.000
0.000 | 0.000
0.314 | 0.327
0.000 | 0.000
4peptides
spectra
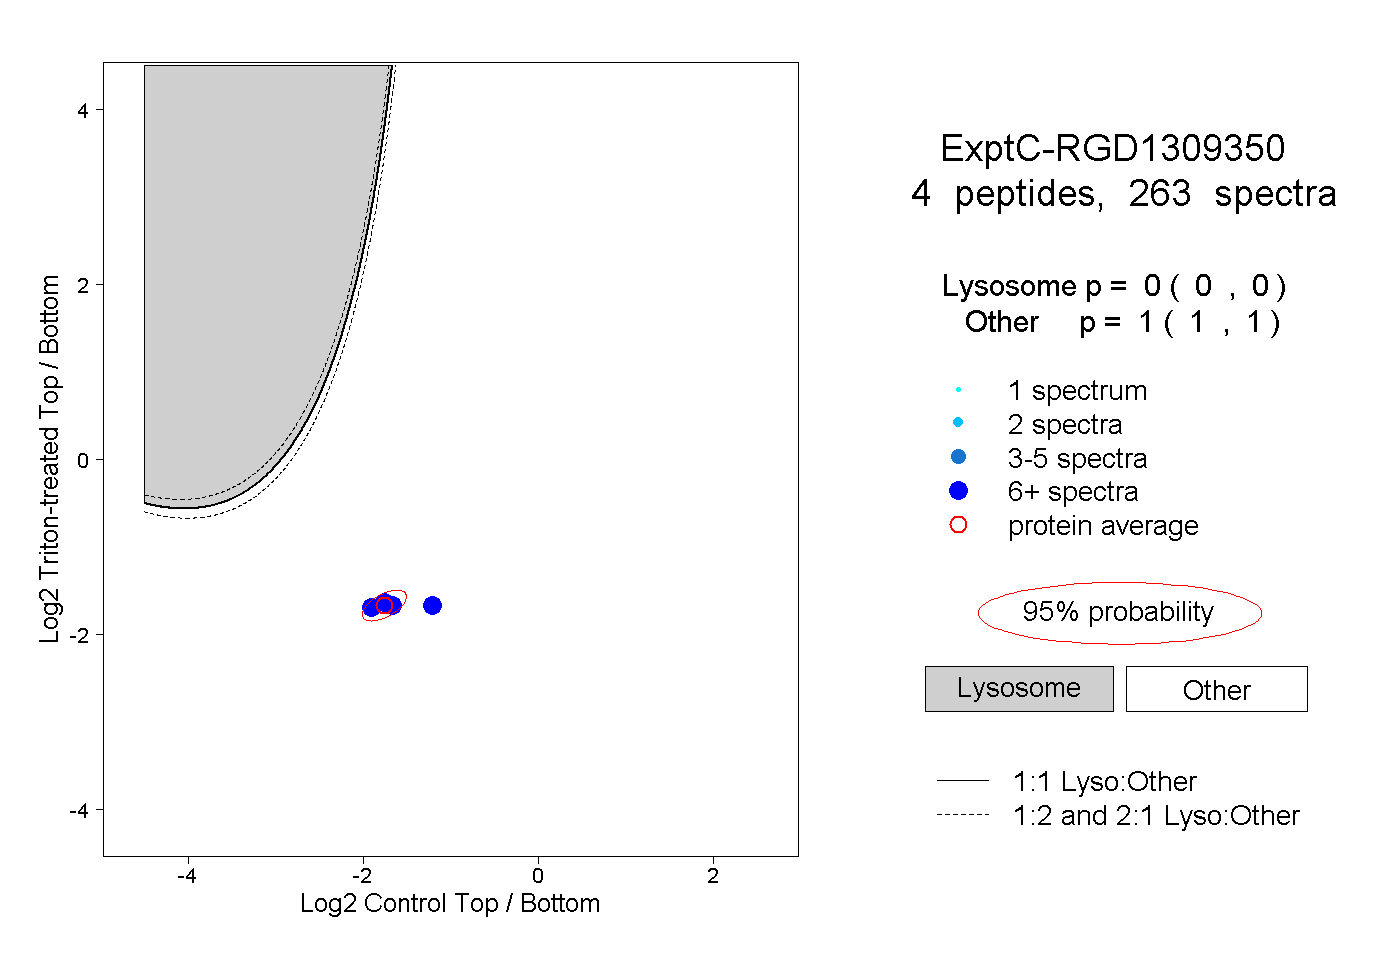
0.000 | 0.000
1.000 | 1.000
2peptides
spectra
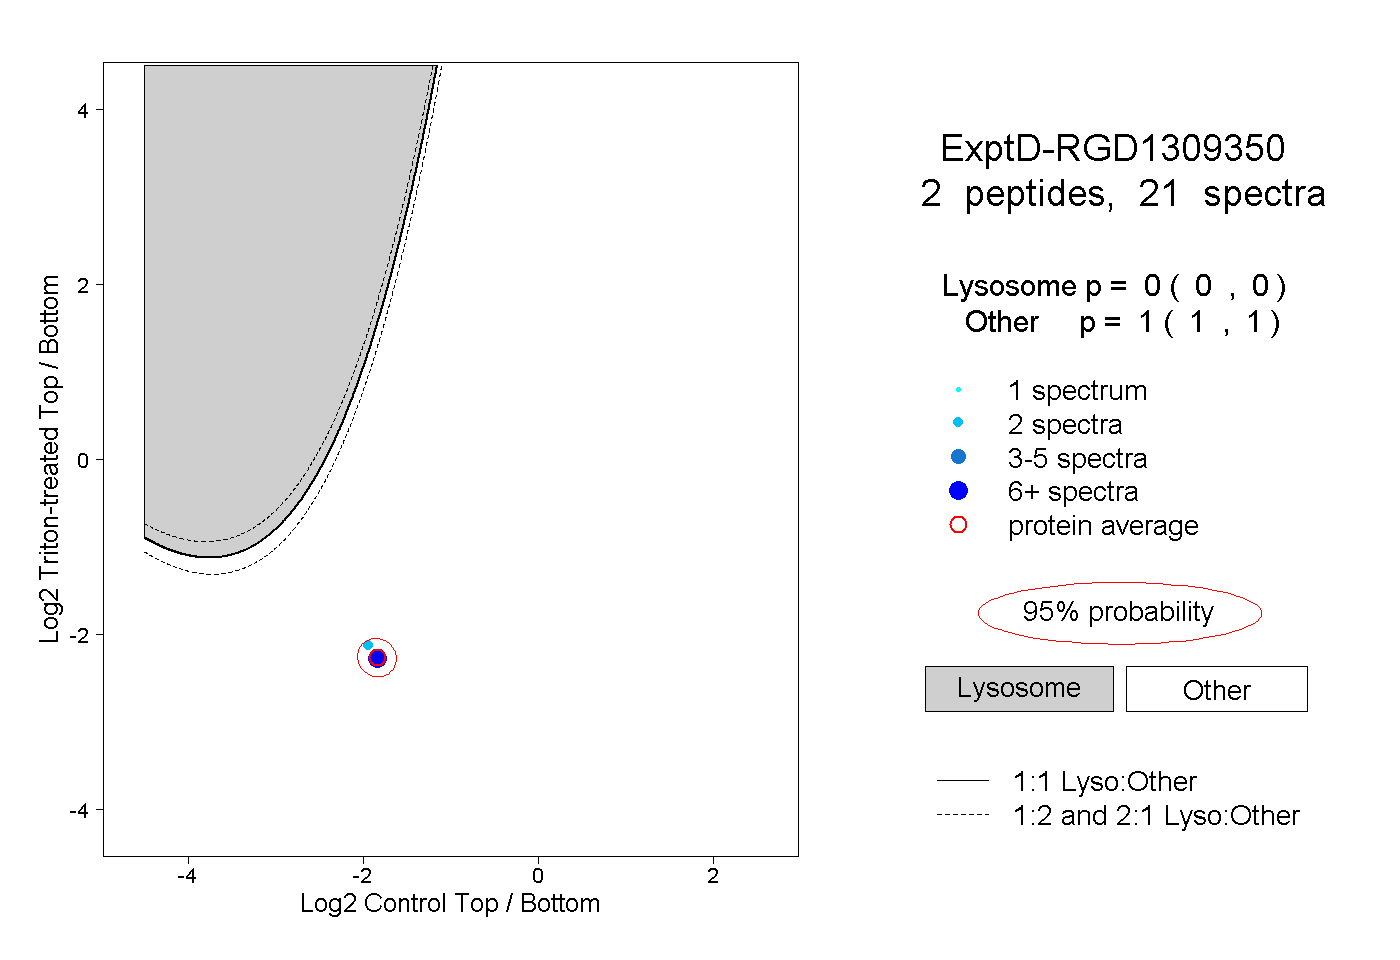
0.000 | 0.000
1.000 | 1.000