RGD1309350
[ENSRNOP00000067773]
Main page
| | | Plot |
Mito |
Lyso |
|
Perox |
ER |
Golgi |
PM |
Cytosol |
Nucleus |
|
| Expt A |
 5
5
peptides |
25
spectra |
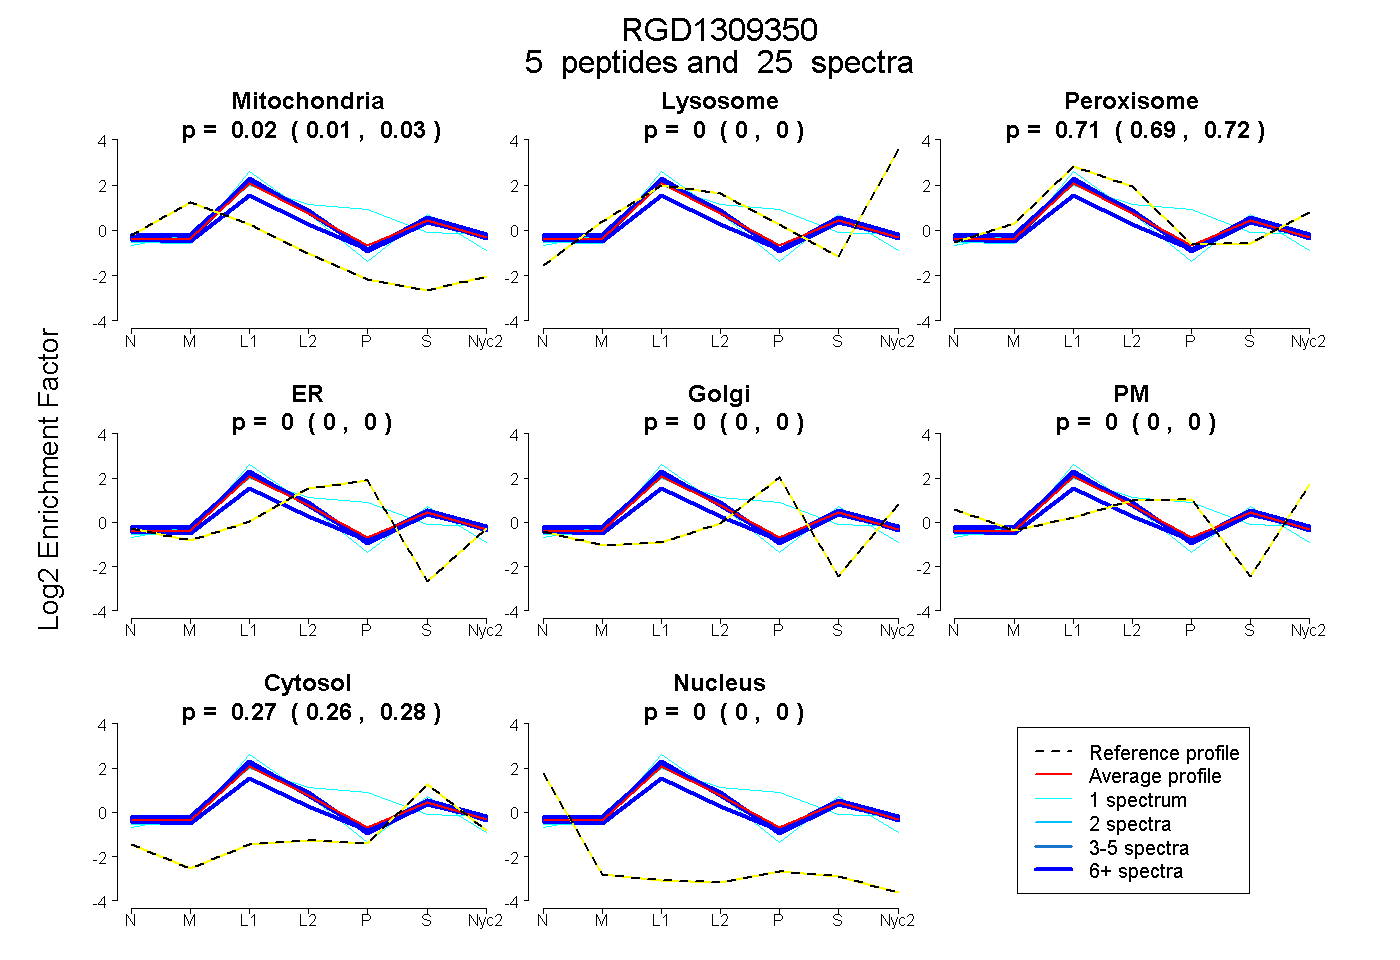 |
0.021
0.007 | 0.028 |
0.000
0.000 | 0.000 |
|
0.707
0.694 | 0.720 |
0.000
0.000 | 0.000 |
0.000
0.000 | 0.000 |
0.000
0.000 | 0.000 |
0.272
0.263 | 0.278 |
0.000
0.000 | 0.005 |
|
| | | Plot |
Mito |
|
Lyso or Perox |
|
ER |
Golgi |
PM |
Cytosol |
Nucleus |
|
| Expt B |
3
peptides |
21
spectra |
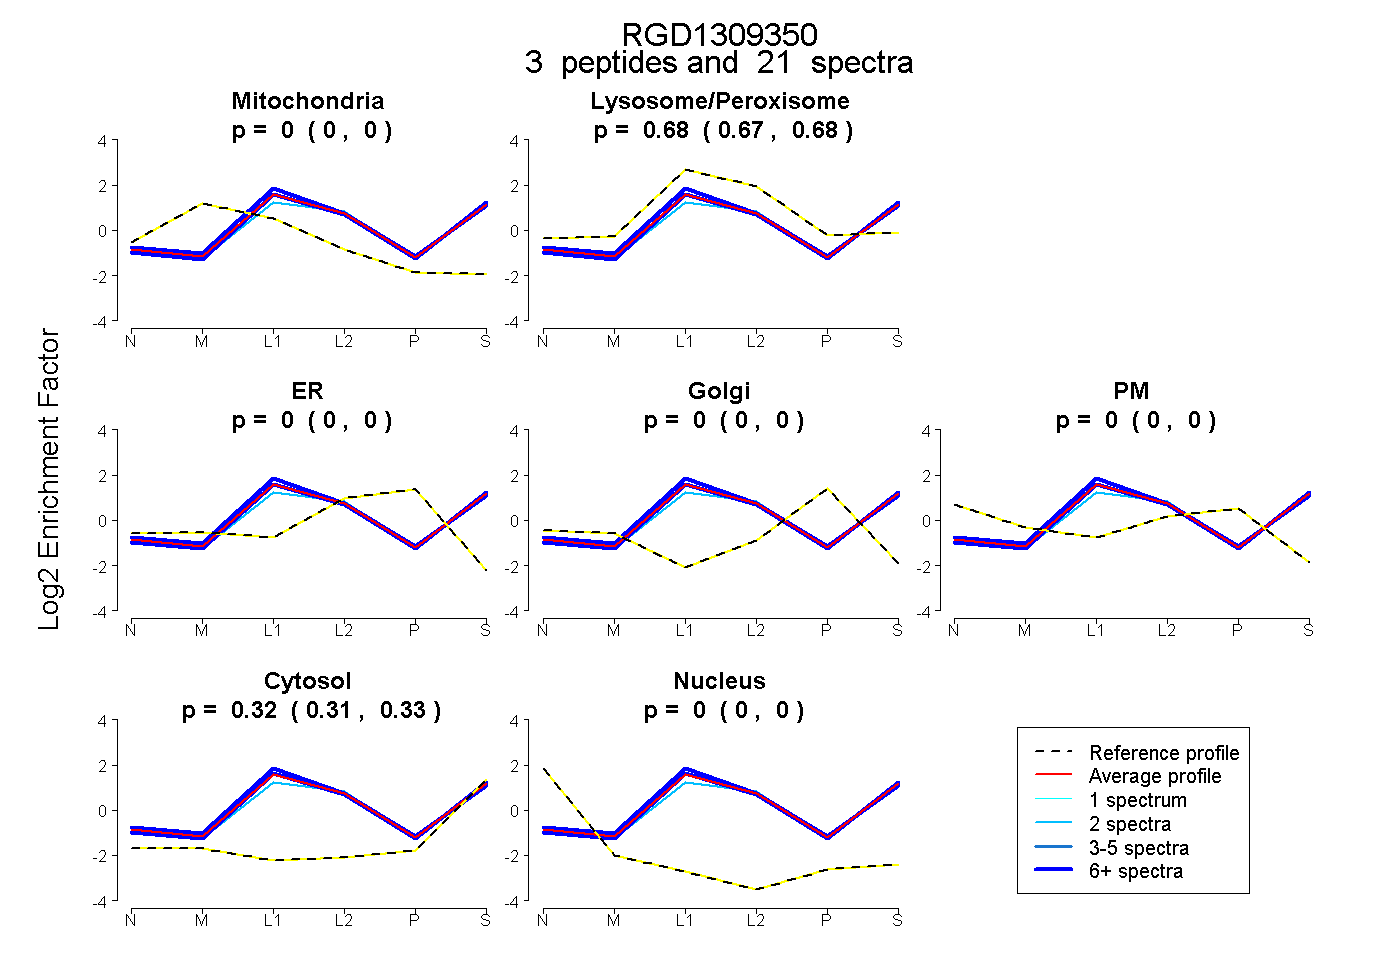 |
0.000
0.000 | 0.000 |
|
0.679
0.672 | 0.684 |
|
0.000
0.000 | 0.000 |
0.000
0.000 | 0.000 |
0.000
0.000 | 0.000 |
0.321
0.314 | 0.327 |
0.000
0.000 | 0.000 |
|
| 2 spectra, LEAPSQQWMELR |
0.000 |
|
0.649 |
|
0.000 |
0.000 |
0.000 |
0.351 |
0.000 |
|
| 8 spectra, LSFDTER |
0.000 |
|
0.714 |
|
0.000 |
0.000 |
0.000 |
0.286 |
0.000 |
|
| 11 spectra, TSYTNLDGR |
0.000 |
|
0.668 |
|
0.000 |
0.000 |
0.000 |
0.332 |
0.000 |
|
| | | Plot |
|
Lyso |
|
|
|
|
|
|
|
Other |
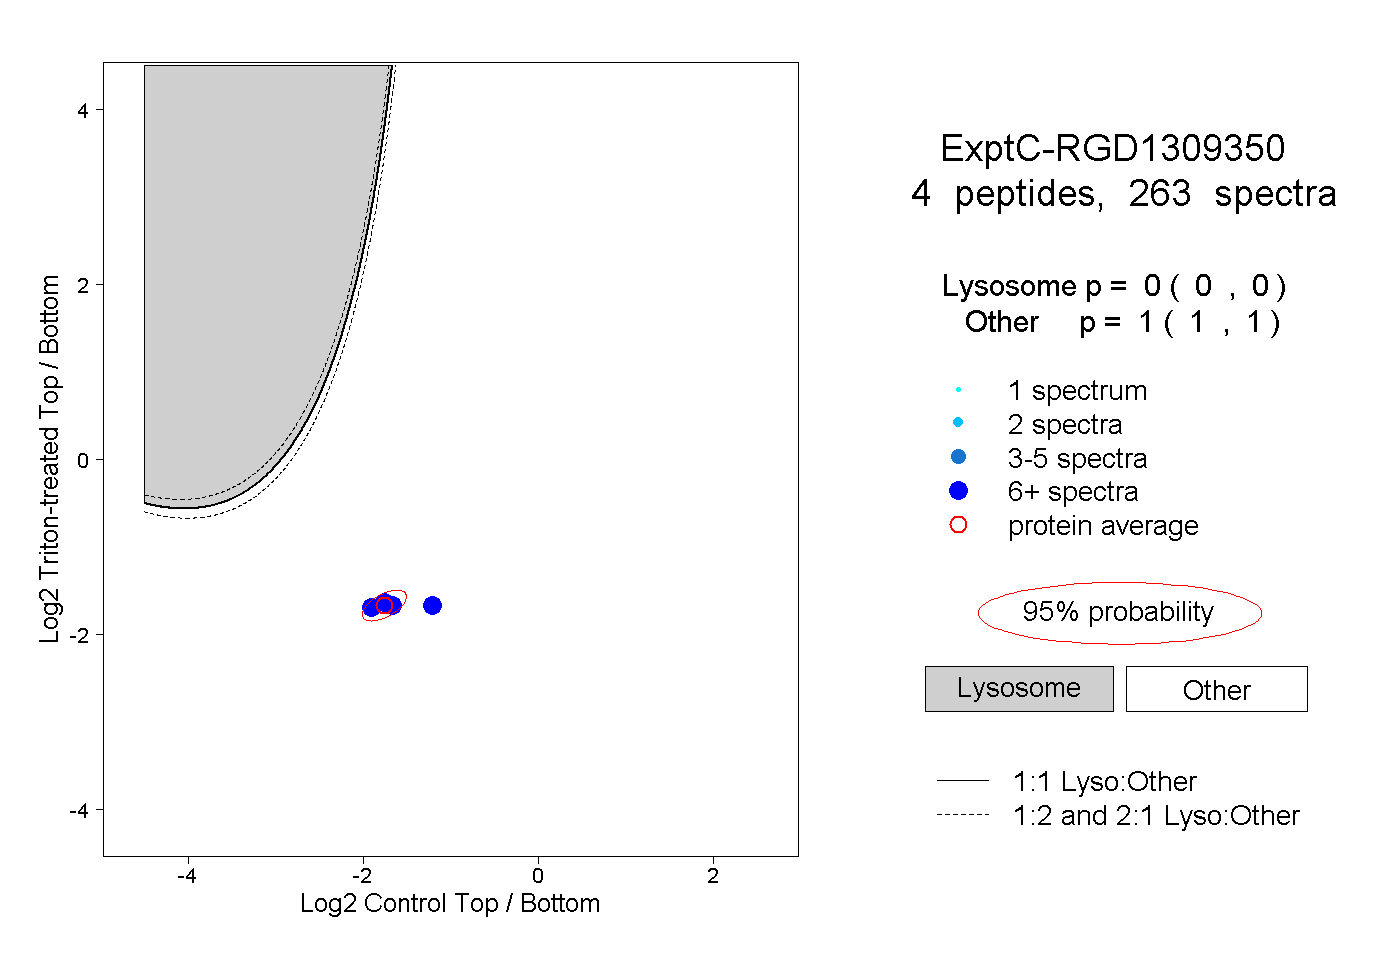
| Expt C |
4
peptides |
263
spectra |
 |
|
0.000
0.000 | 0.000 |
|
|
|
|
|
|
|
1.000
1.000 | 1.000 |
| | | Plot |
|
Lyso |
|
|
|
|
|
|
|
Other |
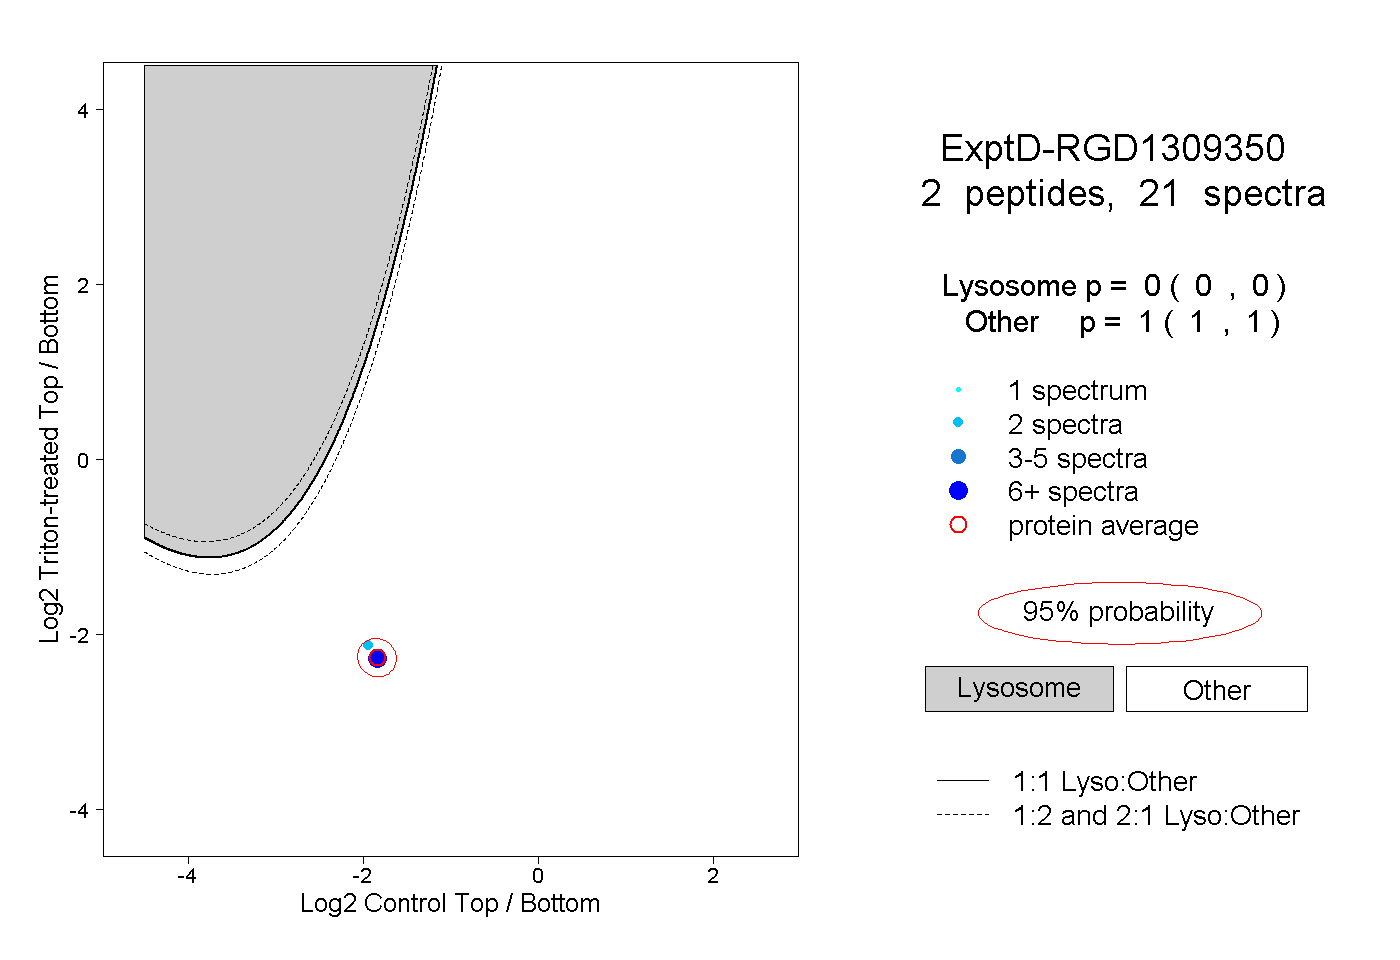
| Expt D |
2
peptides |
21
spectra |
 |
|
0.000
0.000 | 0.000 |
|
|
|
|
|
|
|
1.000
1.000 | 1.000 |