 7
7peptides
spectra
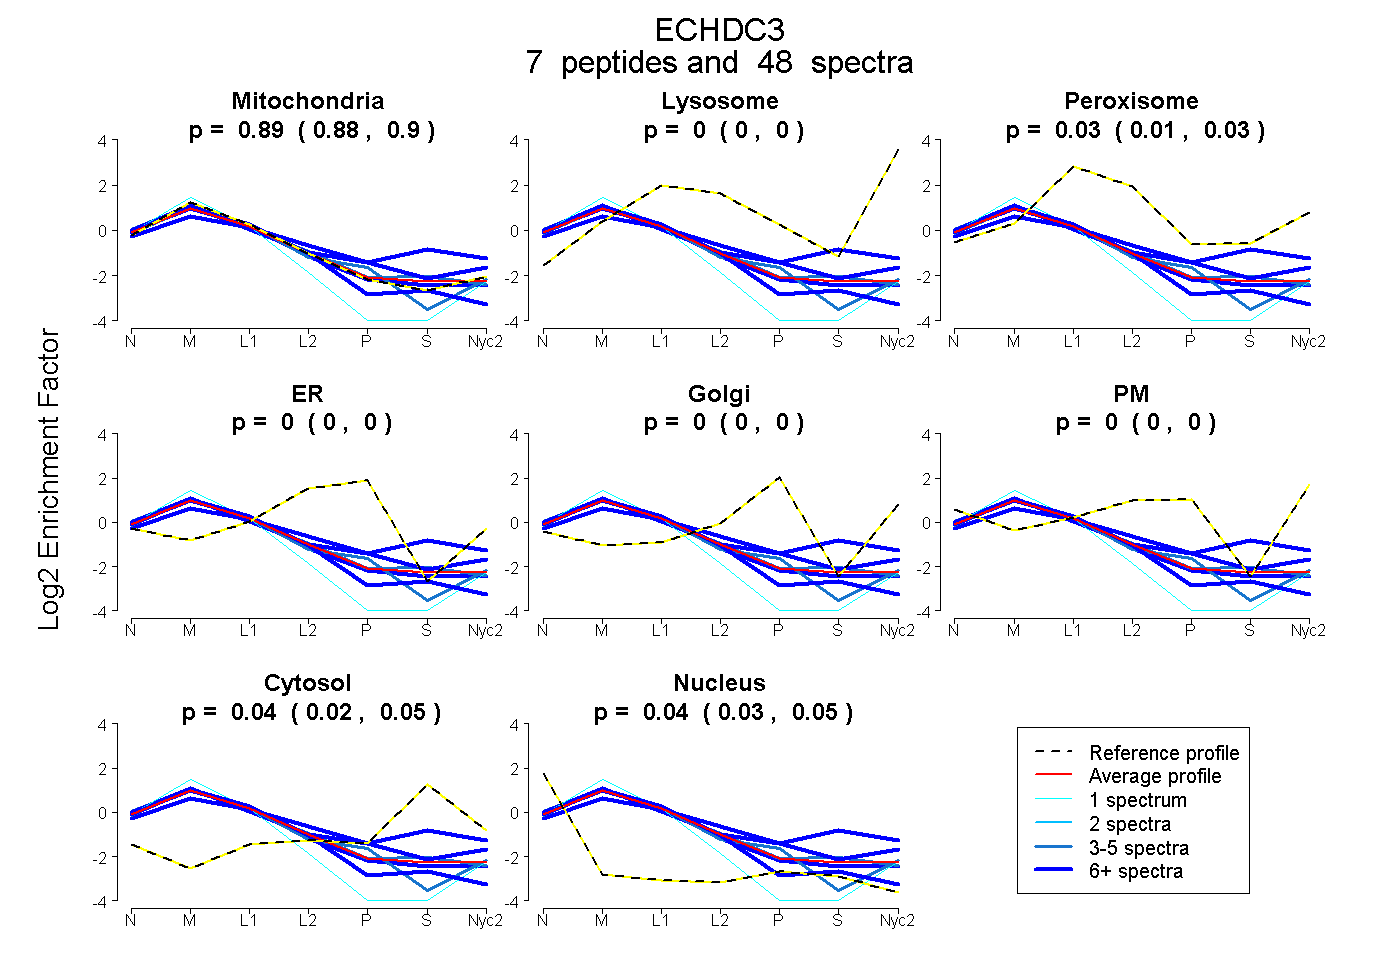
0.881 | 0.903
0.000 | 0.000
0.014 | 0.034
0.000 | 0.003
0.000 | 0.000
0.000 | 0.000
0.021 | 0.052
0.032 | 0.052
5peptides
spectra
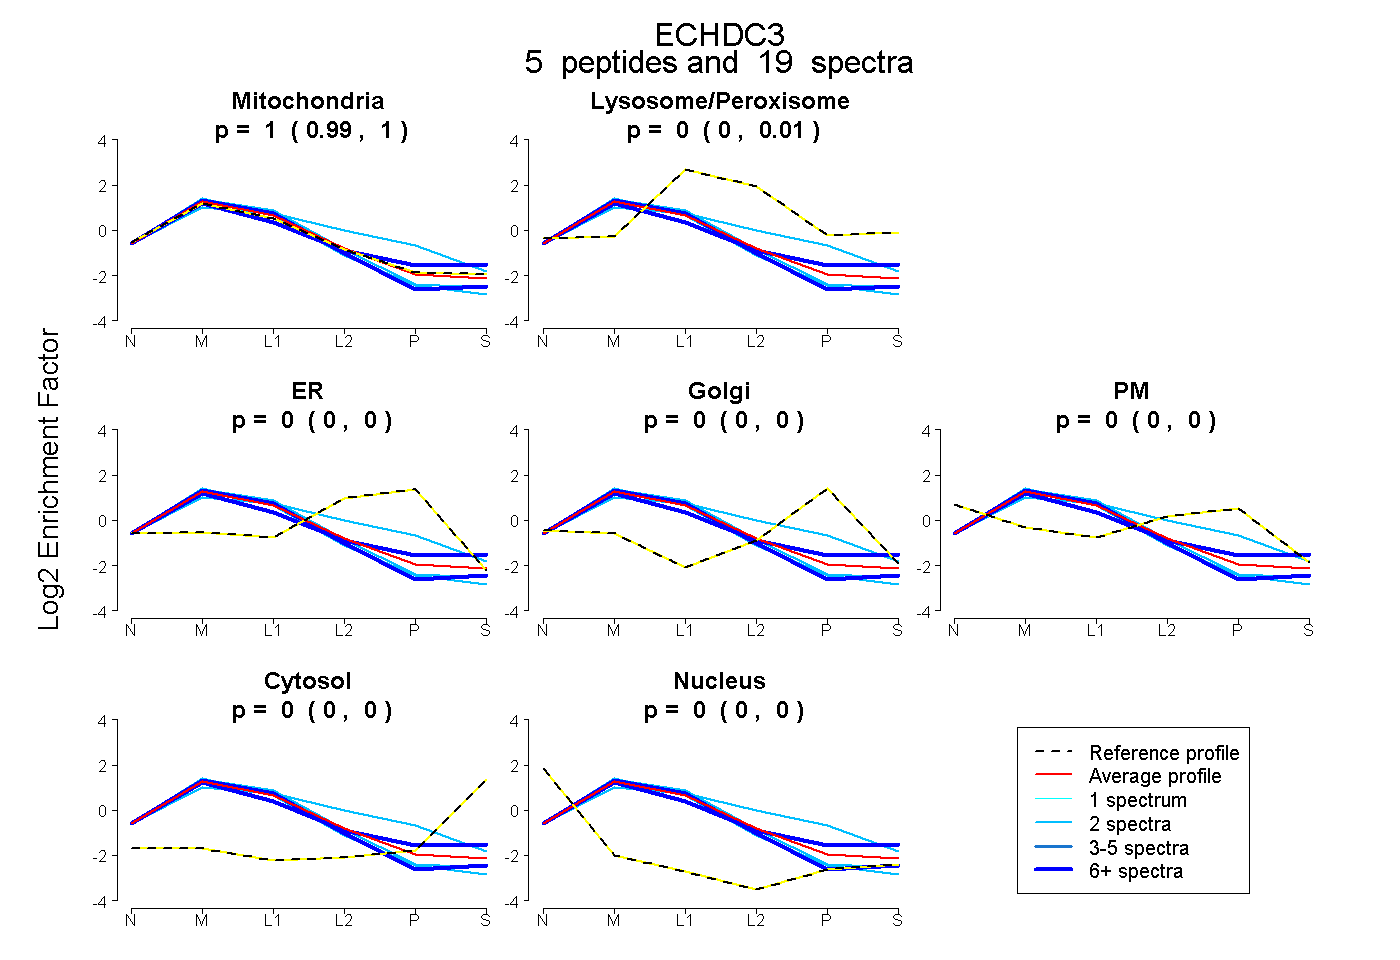
0.988 | 1.000
0.000 | 0.008
0.000 | 0.000
0.000 | 0.000
0.000 | 0.000
0.000 | 0.000
0.000 | 0.000
9peptides
spectra
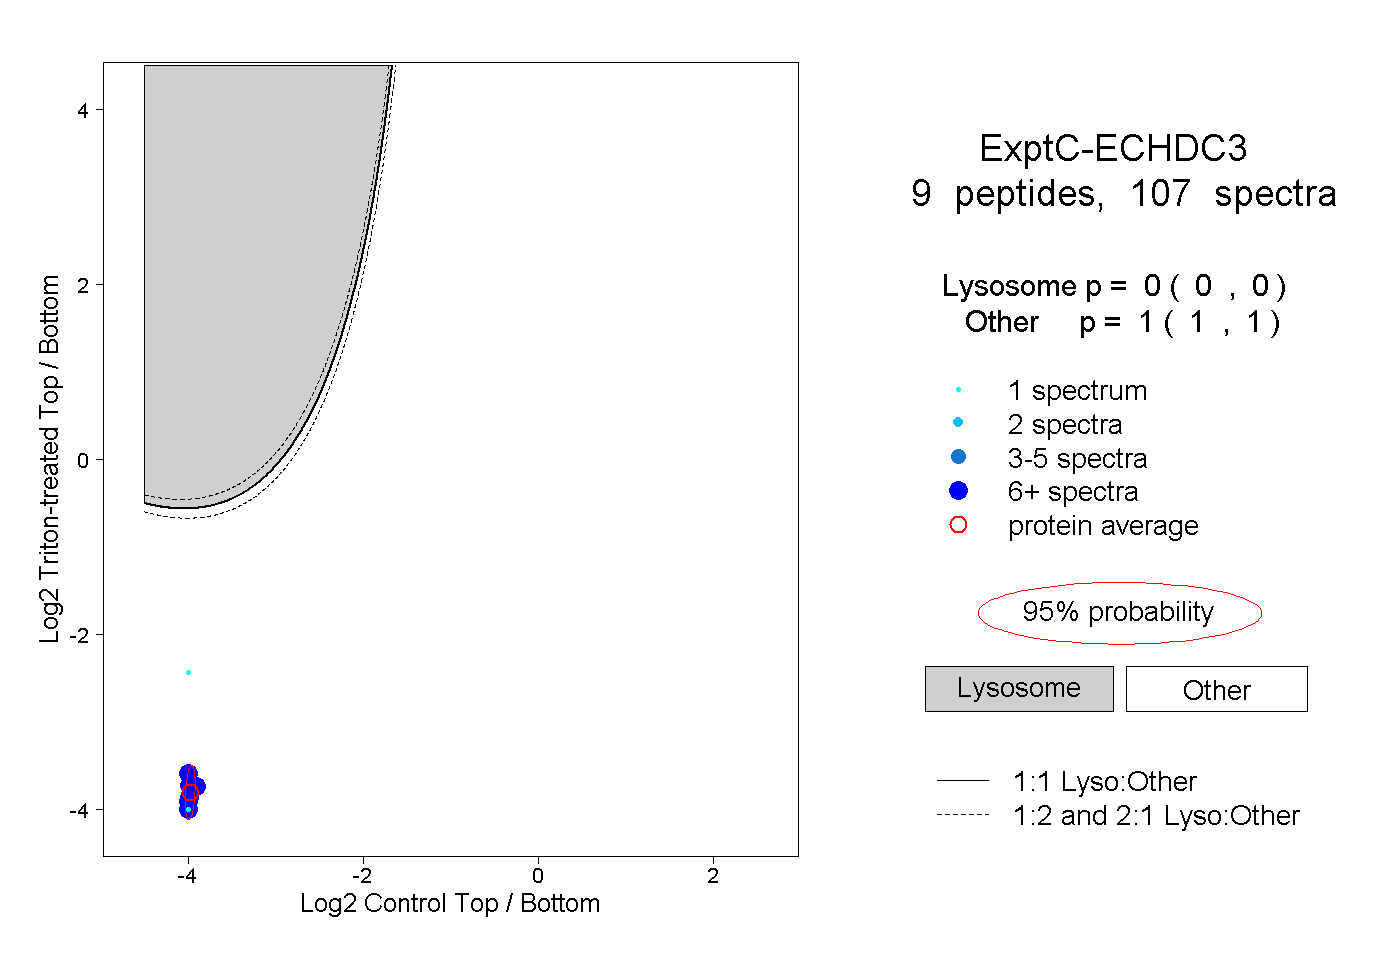
0.000 | 0.000
1.000 | 1.000
6peptides
spectra
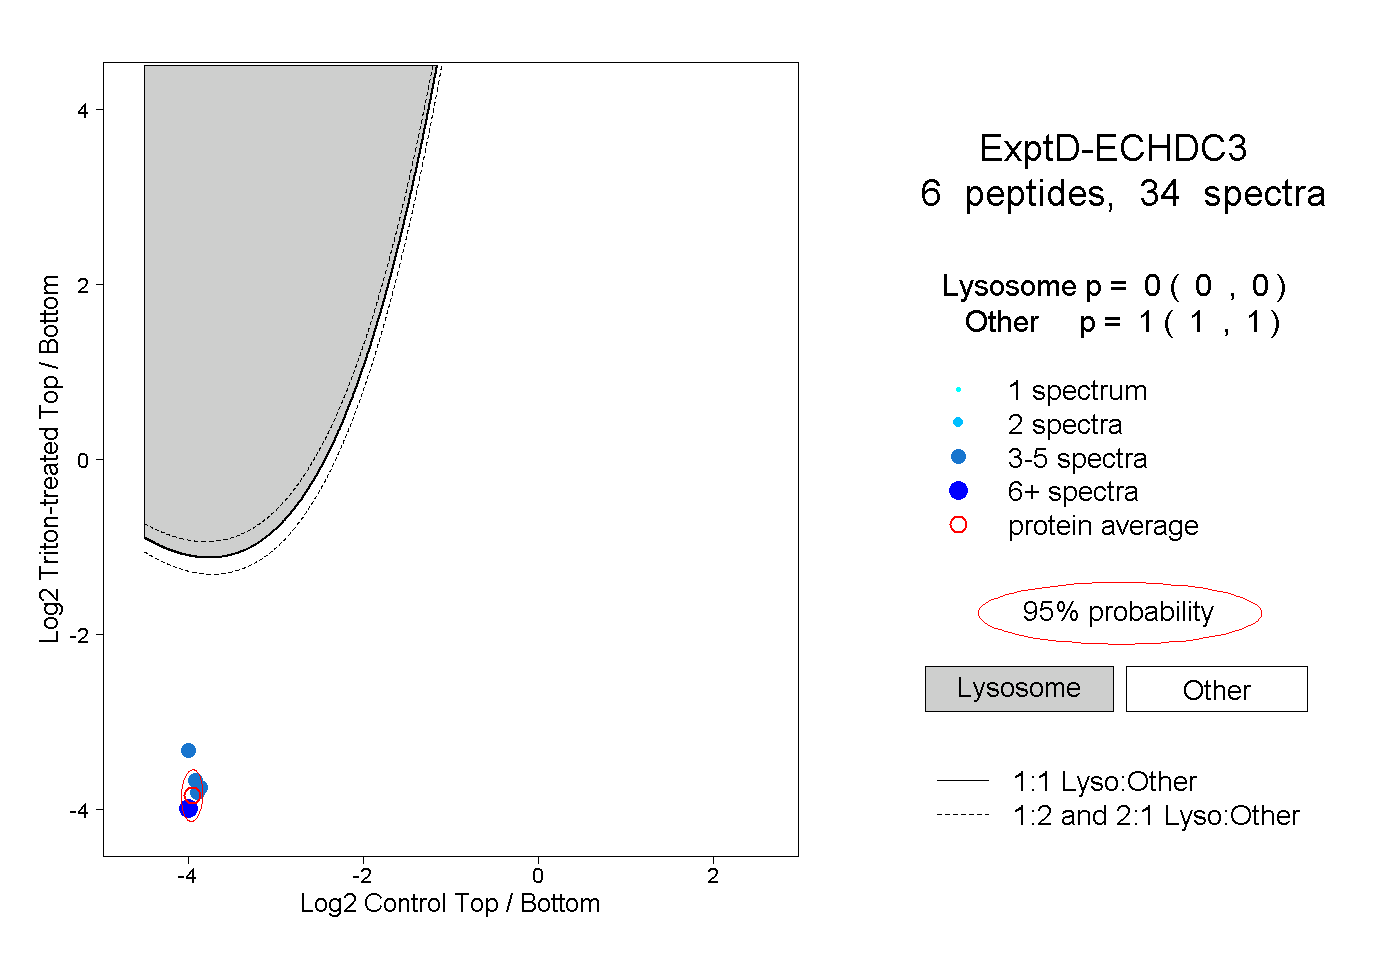
0.000 | 0.000
1.000 | 1.000