 7
7peptides
spectra
0.881 | 0.903
0.000 | 0.000
0.014 | 0.034
0.000 | 0.003
0.000 | 0.000
0.000 | 0.000
0.021 | 0.052
0.032 | 0.052
| Plot | Mito | Lyso | Perox | ER | Golgi | PM | Cytosol | Nucleus | |||||
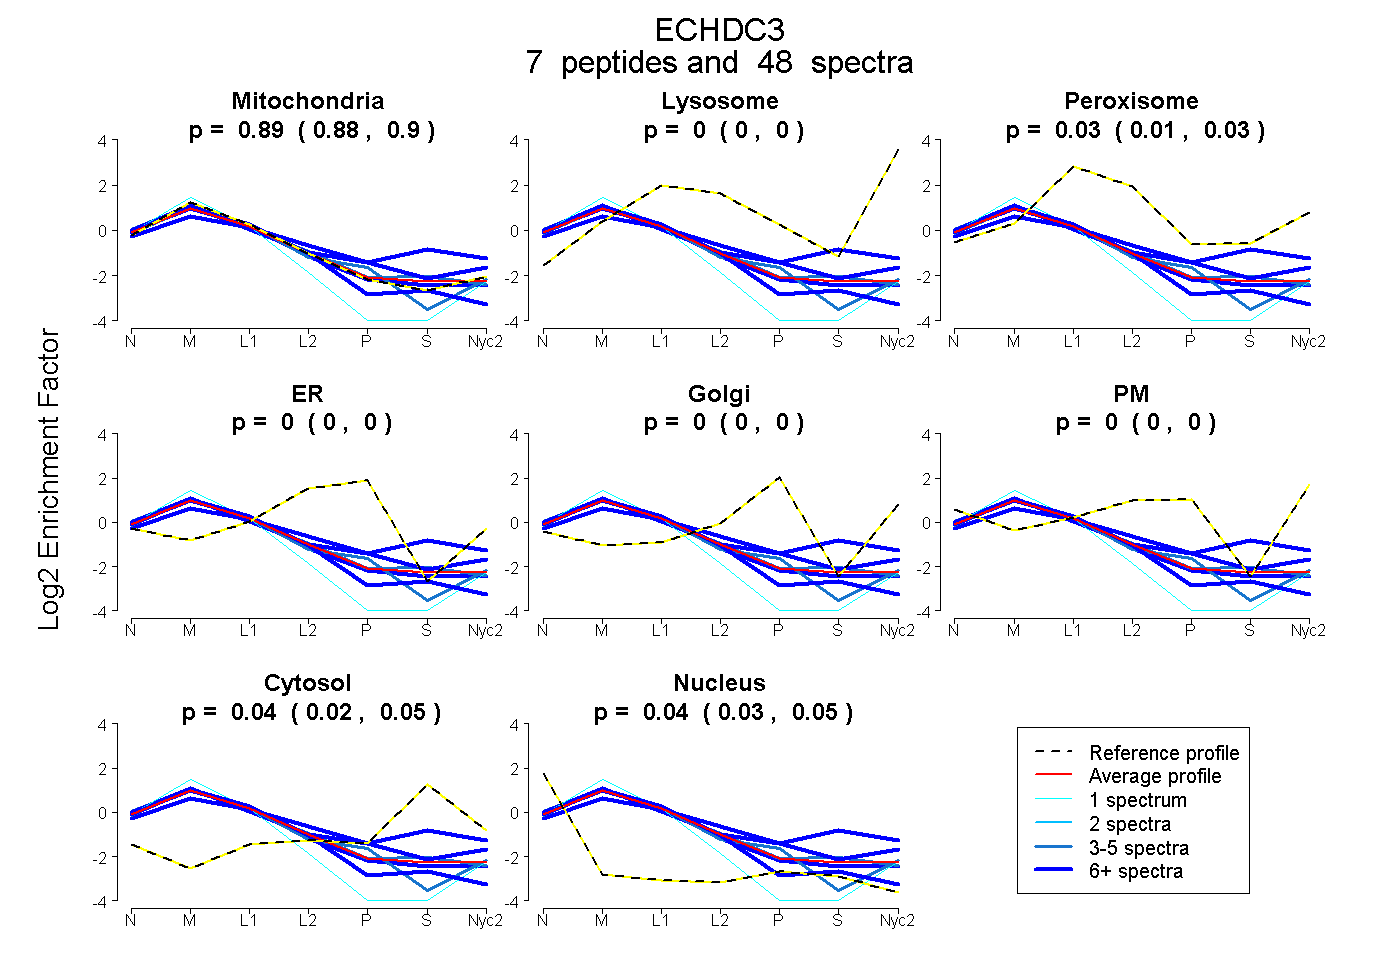
| Expt A |
7 peptides |
48 spectra |
|
0.893 0.881 | 0.903 |
0.000 0.000 | 0.000 |
0.026 0.014 | 0.034 |
0.000 0.000 | 0.003 |
0.000 0.000 | 0.000 |
0.000 0.000 | 0.000 |
0.038 0.021 | 0.052 |
0.043 0.032 | 0.052 |
| 9 spectra, DGQEGIEAFIQK | 0.928 | 0.000 | 0.000 | 0.000 | 0.000 | 0.000 | 0.007 | 0.064 | ||
| 1 spectrum, VALEMLFTGEPISAQEALR | 0.922 | 0.000 | 0.000 | 0.000 | 0.000 | 0.000 | 0.000 | 0.078 | ||
| 8 spectra, IASLSR | 0.823 | 0.000 | 0.000 | 0.000 | 0.081 | 0.048 | 0.049 | 0.000 | ||
| 14 spectra, VVPEEQLEEEATR | 0.911 | 0.000 | 0.000 | 0.000 | 0.000 | 0.000 | 0.000 | 0.089 | ||
| 3 spectra, SVVALGK | 0.887 | 0.000 | 0.000 | 0.064 | 0.000 | 0.000 | 0.000 | 0.049 | ||
| 4 spectra, HGLISK | 0.911 | 0.000 | 0.003 | 0.000 | 0.000 | 0.000 | 0.059 | 0.027 | ||
| 9 spectra, RPVWSH | 0.565 | 0.000 | 0.176 | 0.000 | 0.000 | 0.007 | 0.251 | 0.000 |
| Plot | Mito | Lyso or Perox | ER | Golgi | PM | Cytosol | Nucleus | ||||||
| Expt B |
5 peptides |
19 spectra |
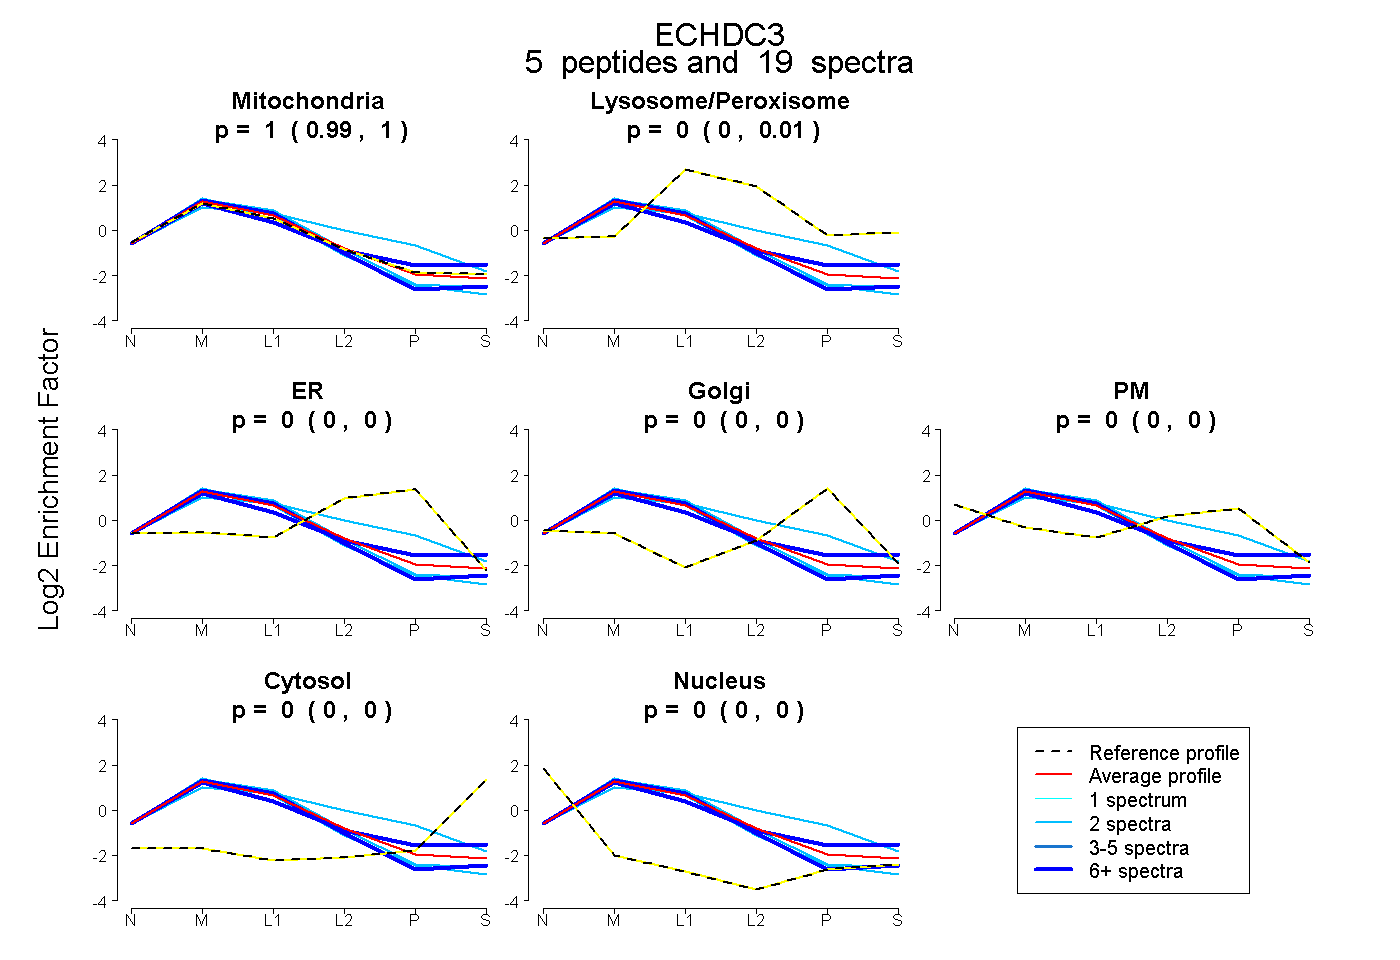 |
1.000 0.988 | 1.000 |
0.000 0.000 | 0.008 |
0.000 0.000 | 0.000 |
0.000 0.000 | 0.000 |
0.000 0.000 | 0.000 |
0.000 0.000 | 0.000 |
0.000 0.000 | 0.000 |
|||
| Plot | Lyso | Other | |||||||||||
| Expt C |
9 peptides |
107 spectra |
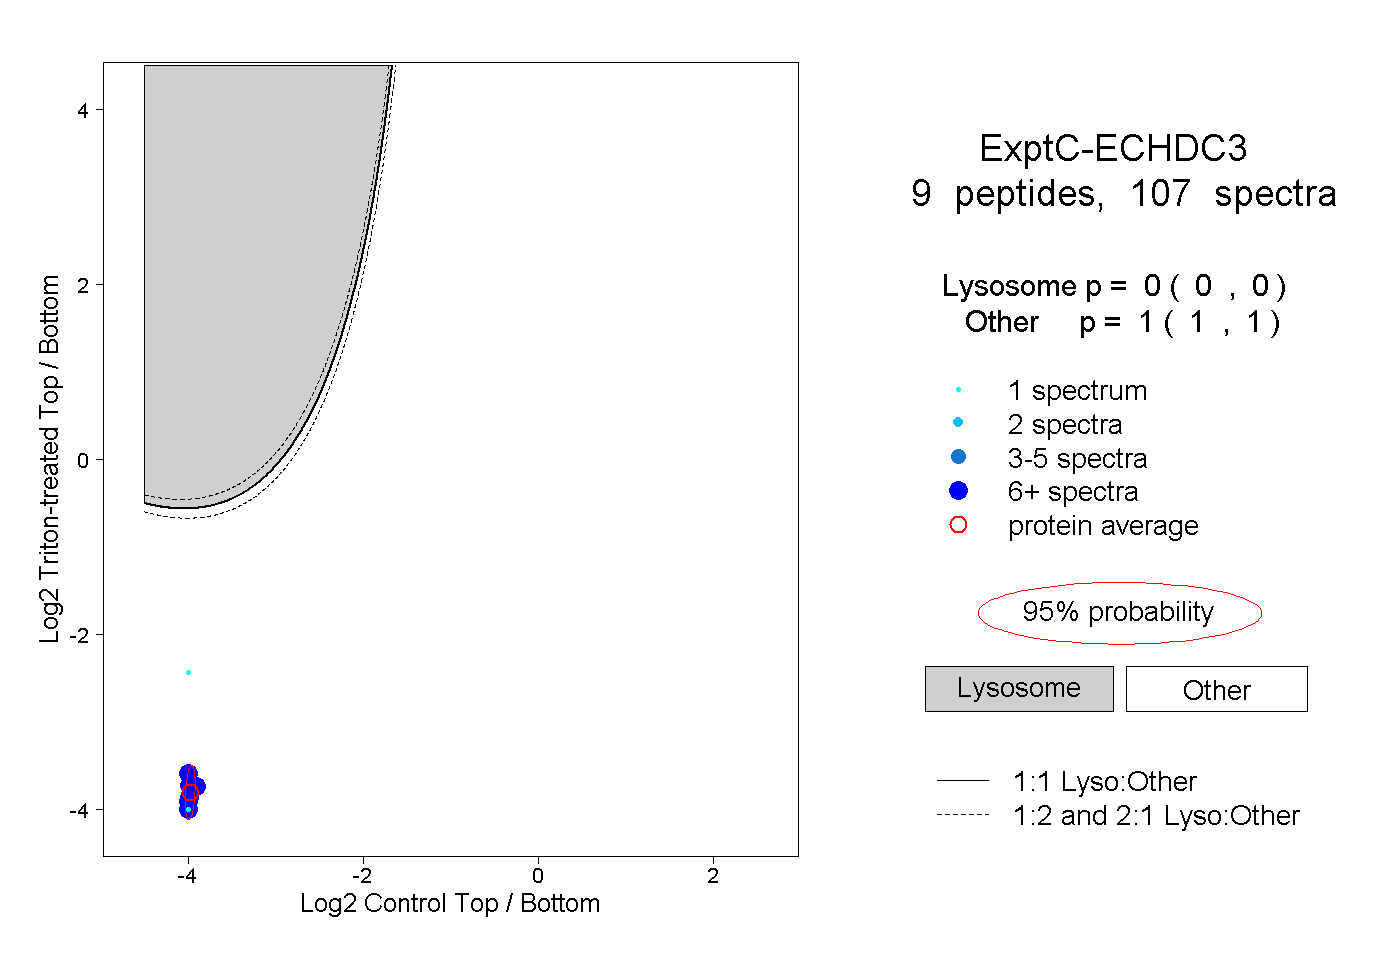 |
0.000 0.000 | 0.000 |
1.000 1.000 | 1.000 |
||||||||
| Plot | Lyso | Other | |||||||||||
| Expt D |
6 peptides |
34 spectra |
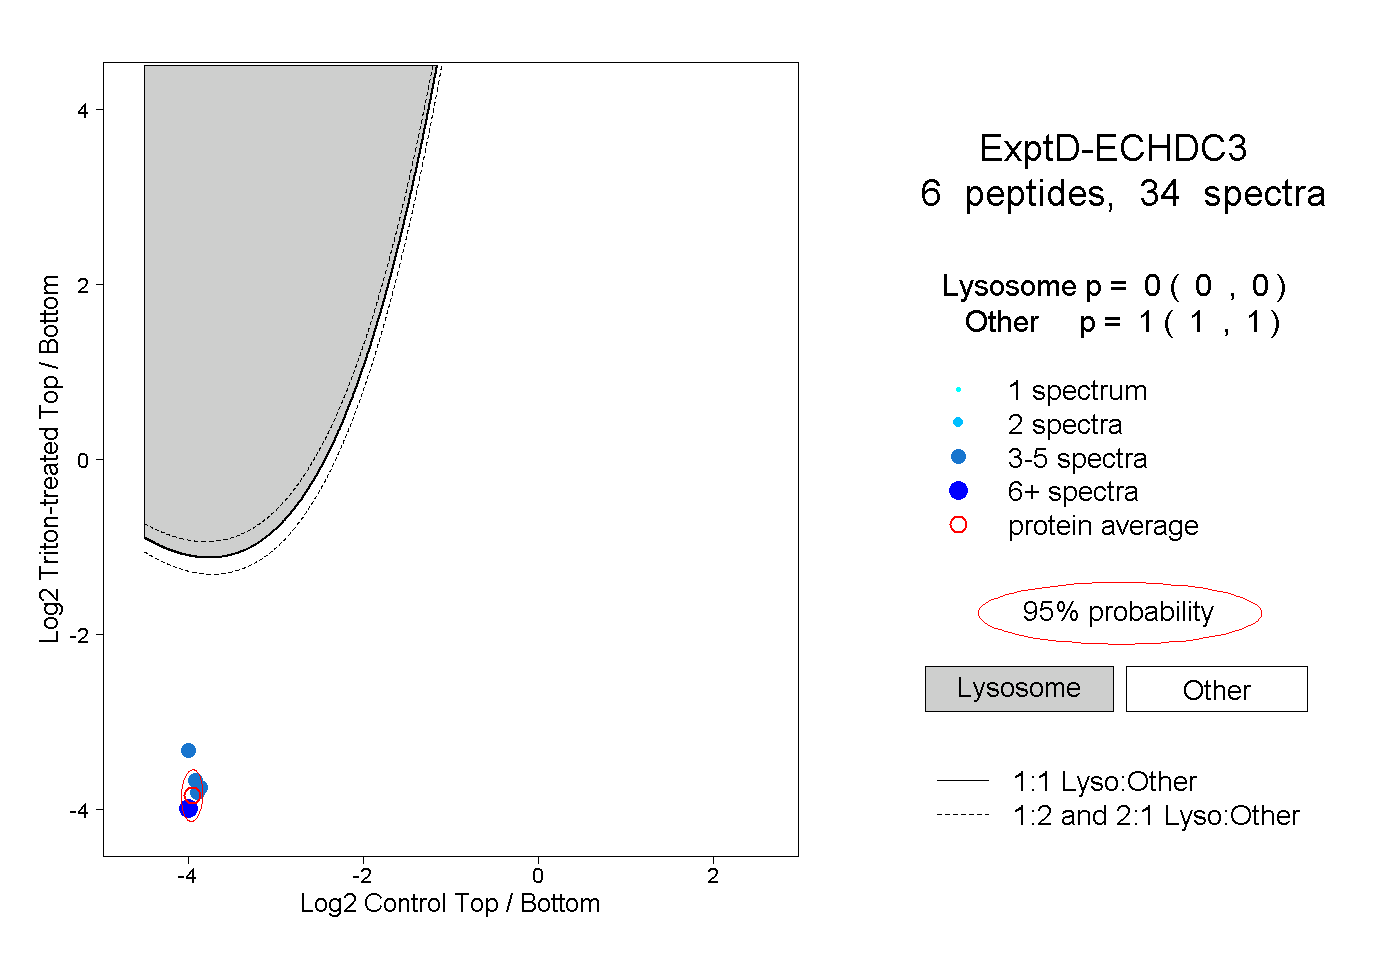 |
0.000 0.000 | 0.000 |
1.000 1.000 | 1.000 |