 13
13peptides
spectra
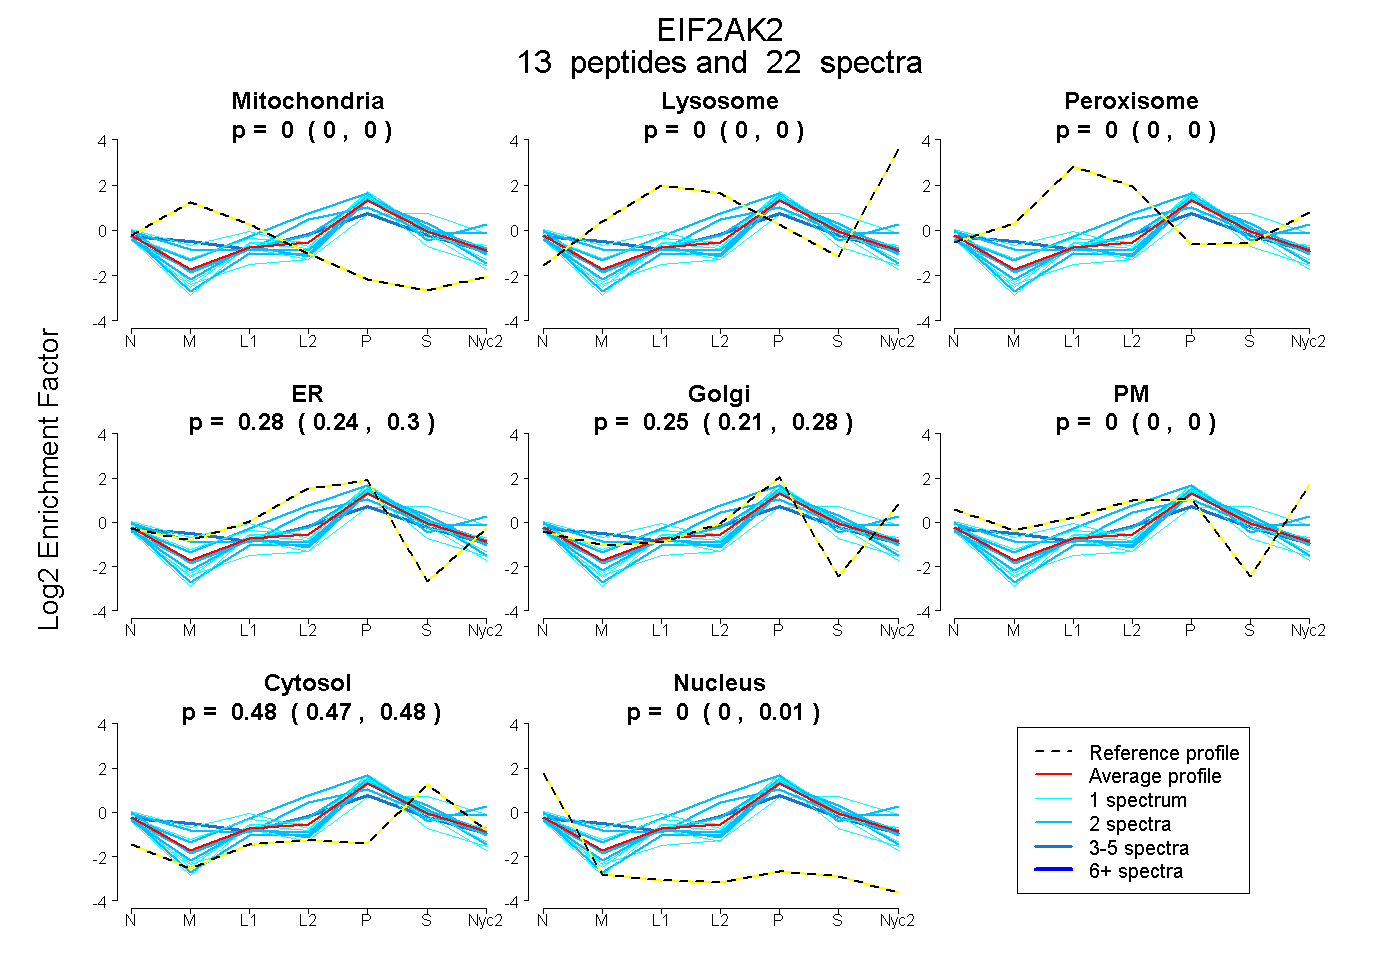
0.000 | 0.000
0.000 | 0.000
0.000 | 0.000
0.245 | 0.304
0.210 | 0.275
0.000 | 0.000
0.467 | 0.482
0.000 | 0.009
3peptides
spectra
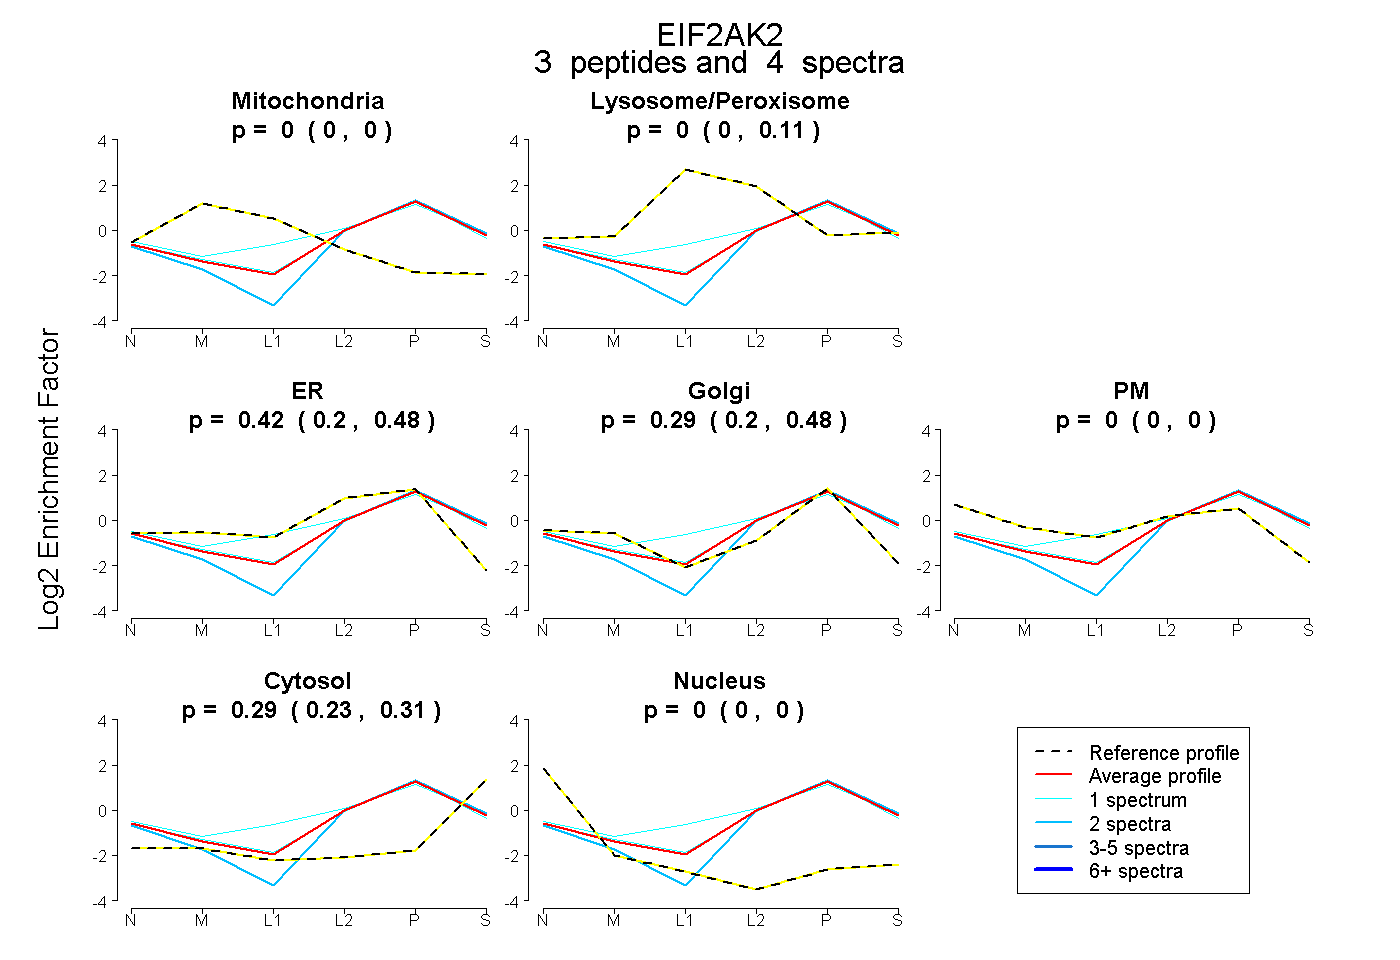
0.000 | 0.000
0.000 | 0.108
0.199 | 0.482
0.201 | 0.480
0.000 | 0.000
0.235 | 0.306
0.000 | 0.000
11peptides
spectra
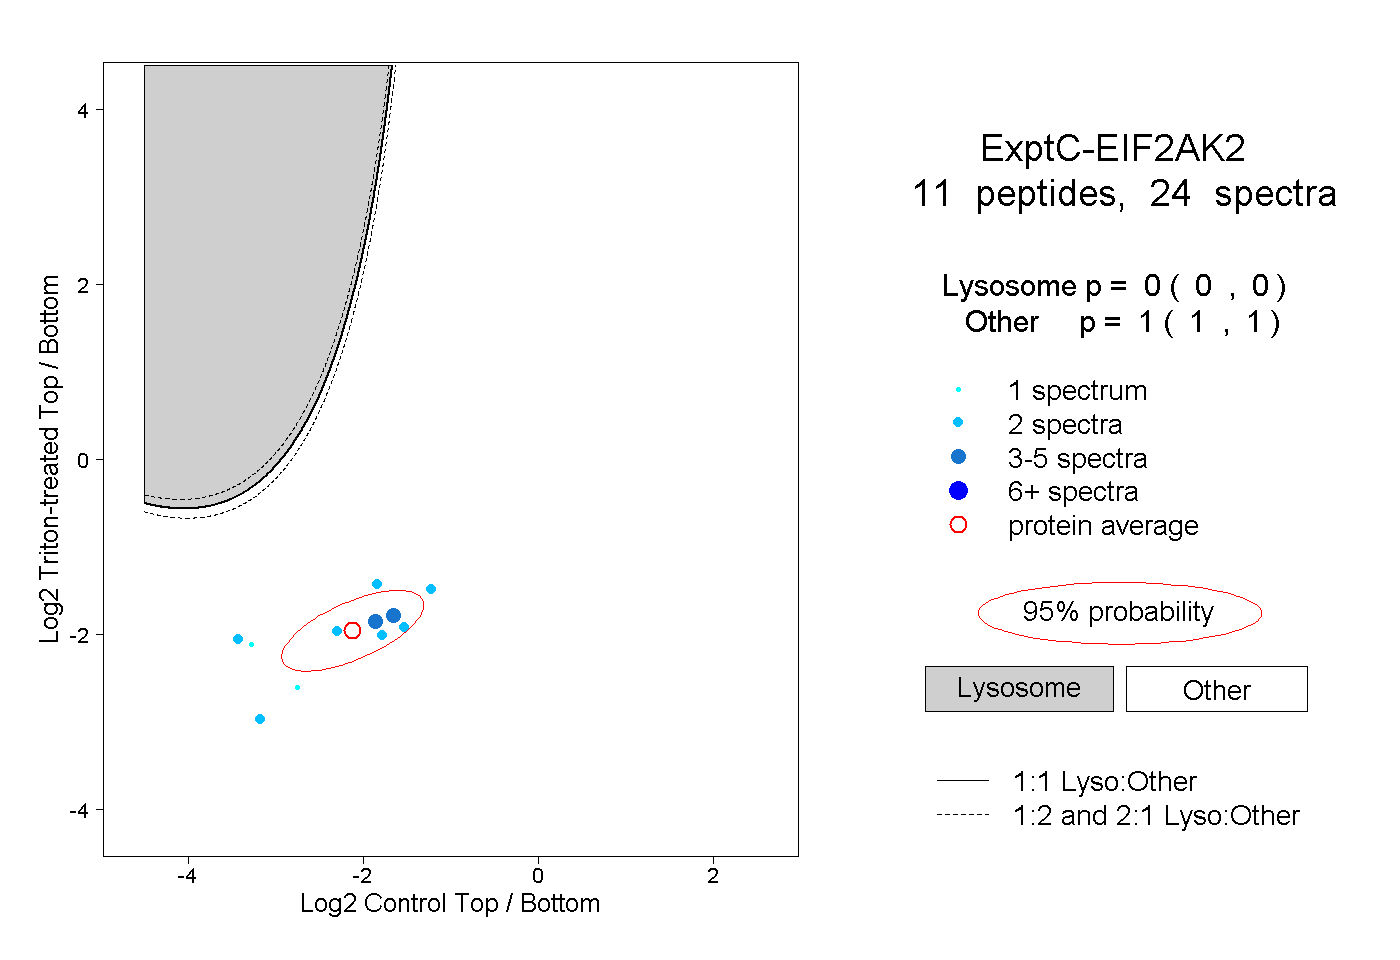
0.000 | 0.000
1.000 | 1.000
2peptides
spectra
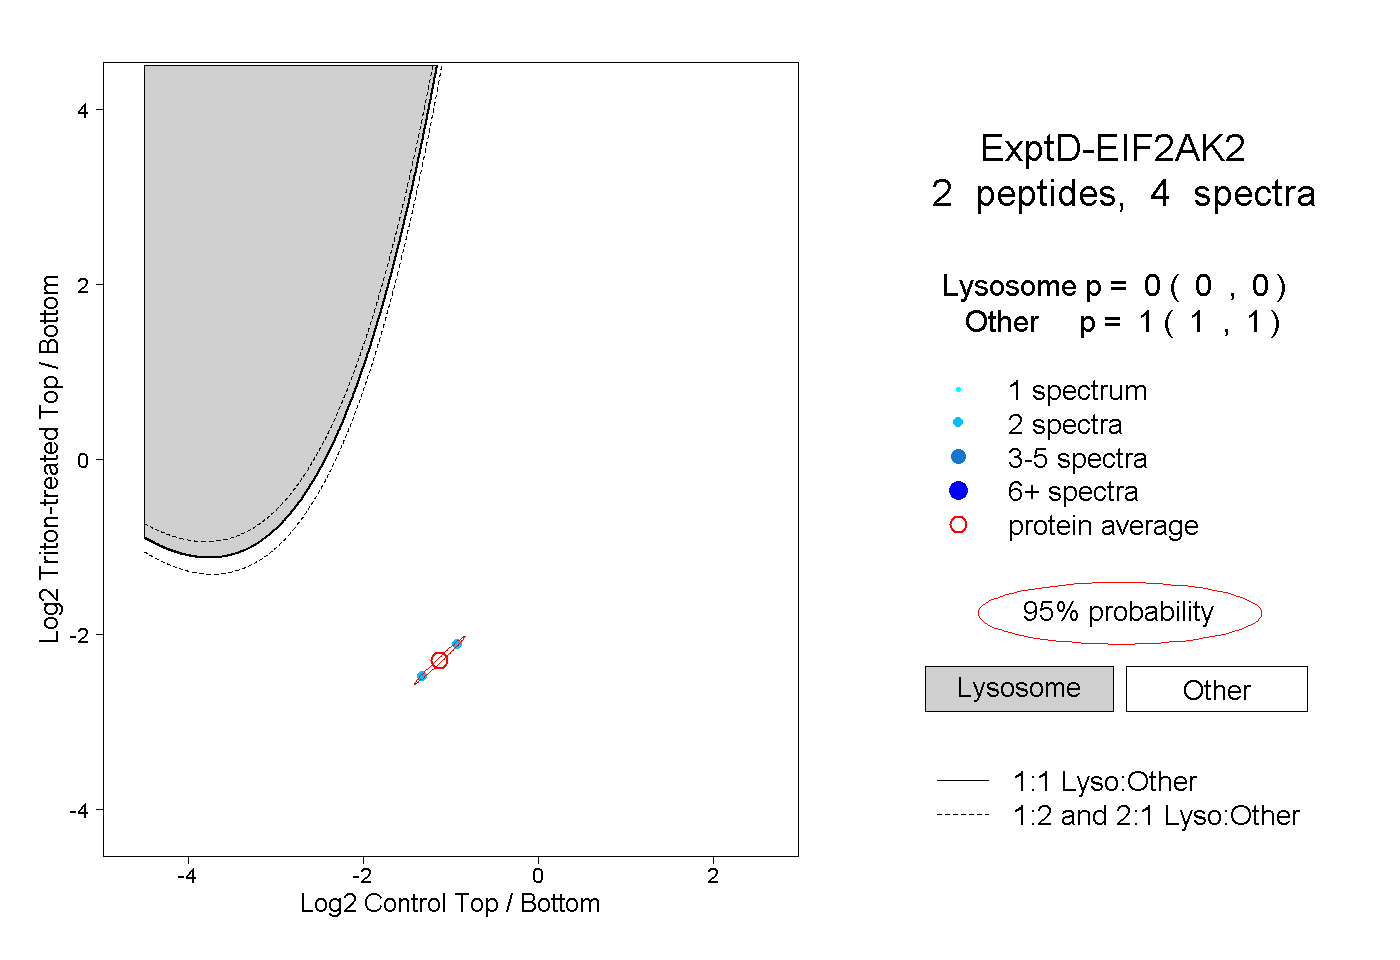
0.000 | 0.000
1.000 | 1.000